
Beyond 60/40: Building a Portfolio That Survives Every Regime
Diversifying and predicting what you can predict

In Germany, we call it the *Pantoffelportfolio*—the slipper portfolio. You set it up once, rebalance occasionally, and otherwise forget about it. Sixty percent stocks, forty percent bonds, and you can manage your retirement in your slippers. For anyone who has accepted that market timing is a fool’s errand but still wants some protection against volatility, this has been the sensible default for decades.
The logic is straightforward: stocks provide long-term growth, bonds act as ballast. When equities fall, bonds typically rise, which smooths out the ride. The negative correlation between these two asset classes has been reasonably reliable for most of the past twenty years, so the diversification actually delivers—most of the time.
But 2022 demonstrated what happens when that assumption breaks. Stocks fell. Bonds fell right alongside them. The 60/40 portfolio experienced its worst year since 2008, and the diversification benefit vanished precisely when investors needed it most. This was not some unforeseeable tail event; it was a regime shift. And if you examine the historical record, you find that such shifts occur more frequently than the standard narrative suggests.
The Baseline
Before trying to improve on something, it makes sense to understand what we are actually starting with. Here is the 60/40 portfolio implemented with VTI for US equities and TLT for long-term treasuries, rebalanced at month-end:
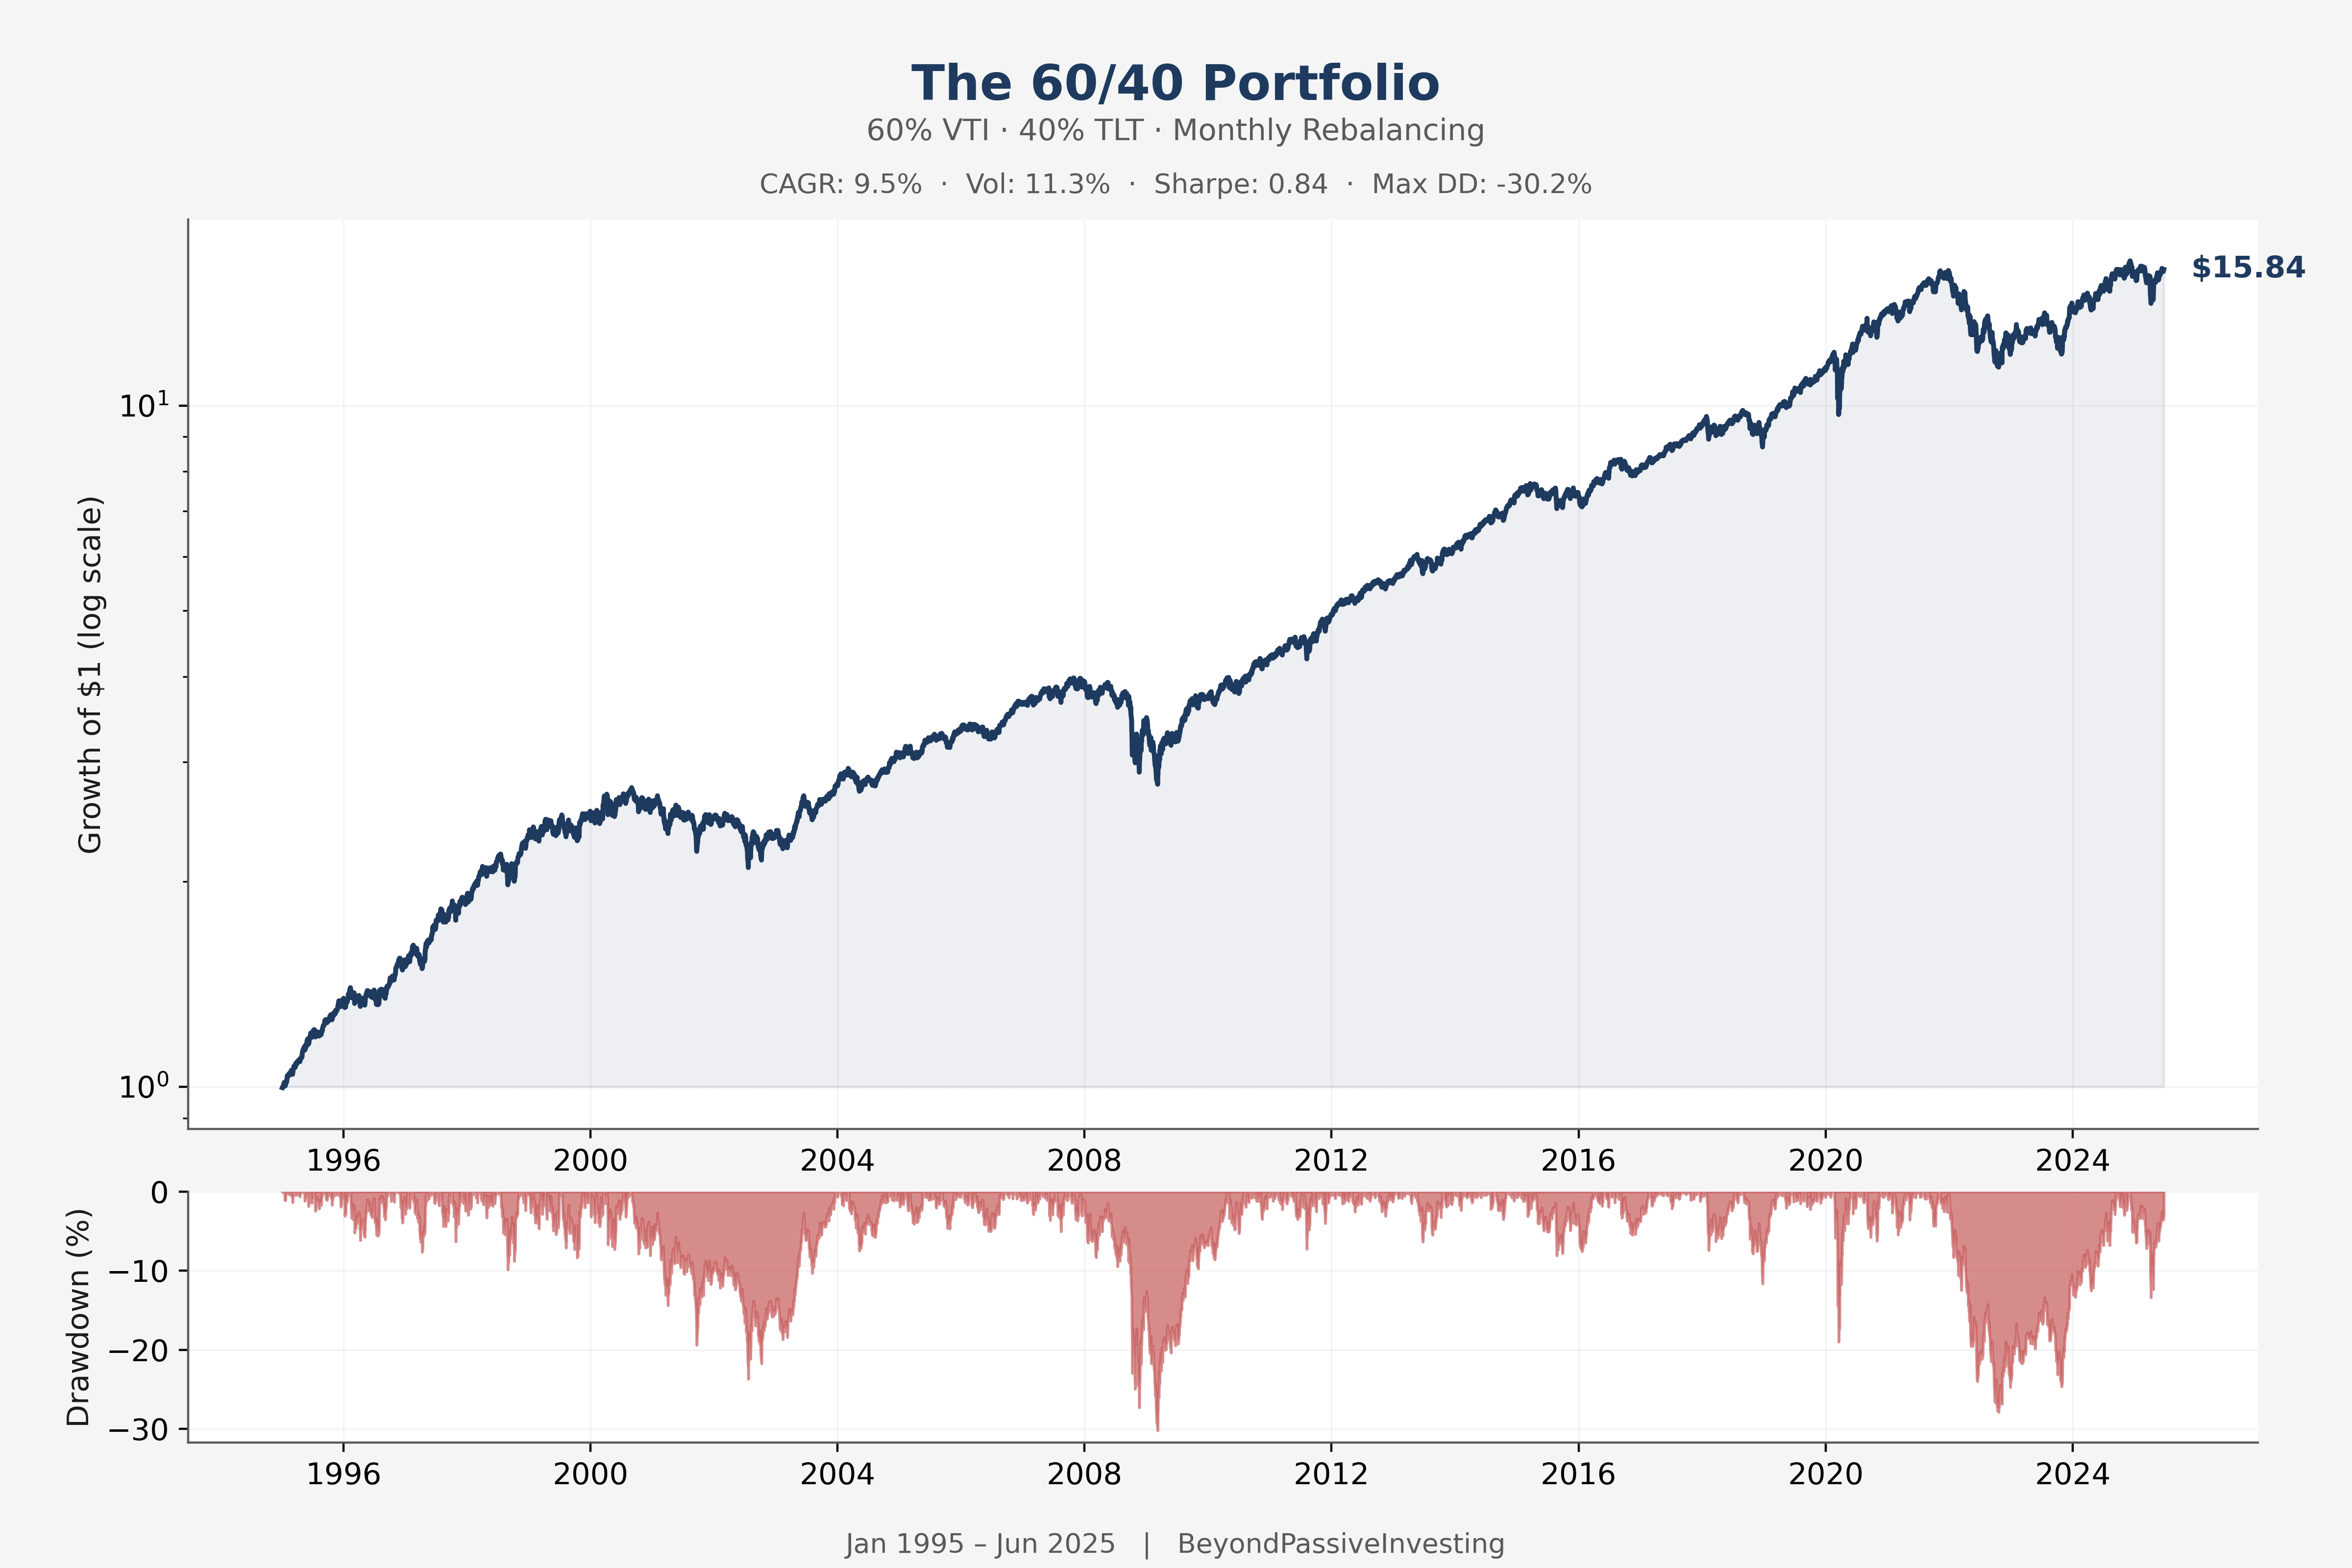
The numbers are not terrible in absolute terms. A 9.5% compound annual return with a Sharpe ratio of 0.84 would satisfy most investors in most decades. But that maximum drawdown of over 30% is worth contemplating. For a portfolio that is supposed to be the safe, balanced option—the thing you do not have to worry about—losing nearly a third of your wealth is a significant psychological and financial hit.
The deeper problem is that the 60/40 portfolio is not actually diversified across economic regimes. It is concentrated in assets that perform well when inflation is falling or stable and central banks are willing to cut interest rates. When the macroeconomic environment shifts—say, toward rising inflation with tightening monetary policy—both legs of the portfolio can fail simultaneously.
When Diversification Fails
The entire premise of 60/40 rests on a single assumption: that stock-bond correlation is negative. When this holds, bonds provide a genuine hedge against equity drawdowns. But correlation is not a law of physics; it is a regime-dependent variable.
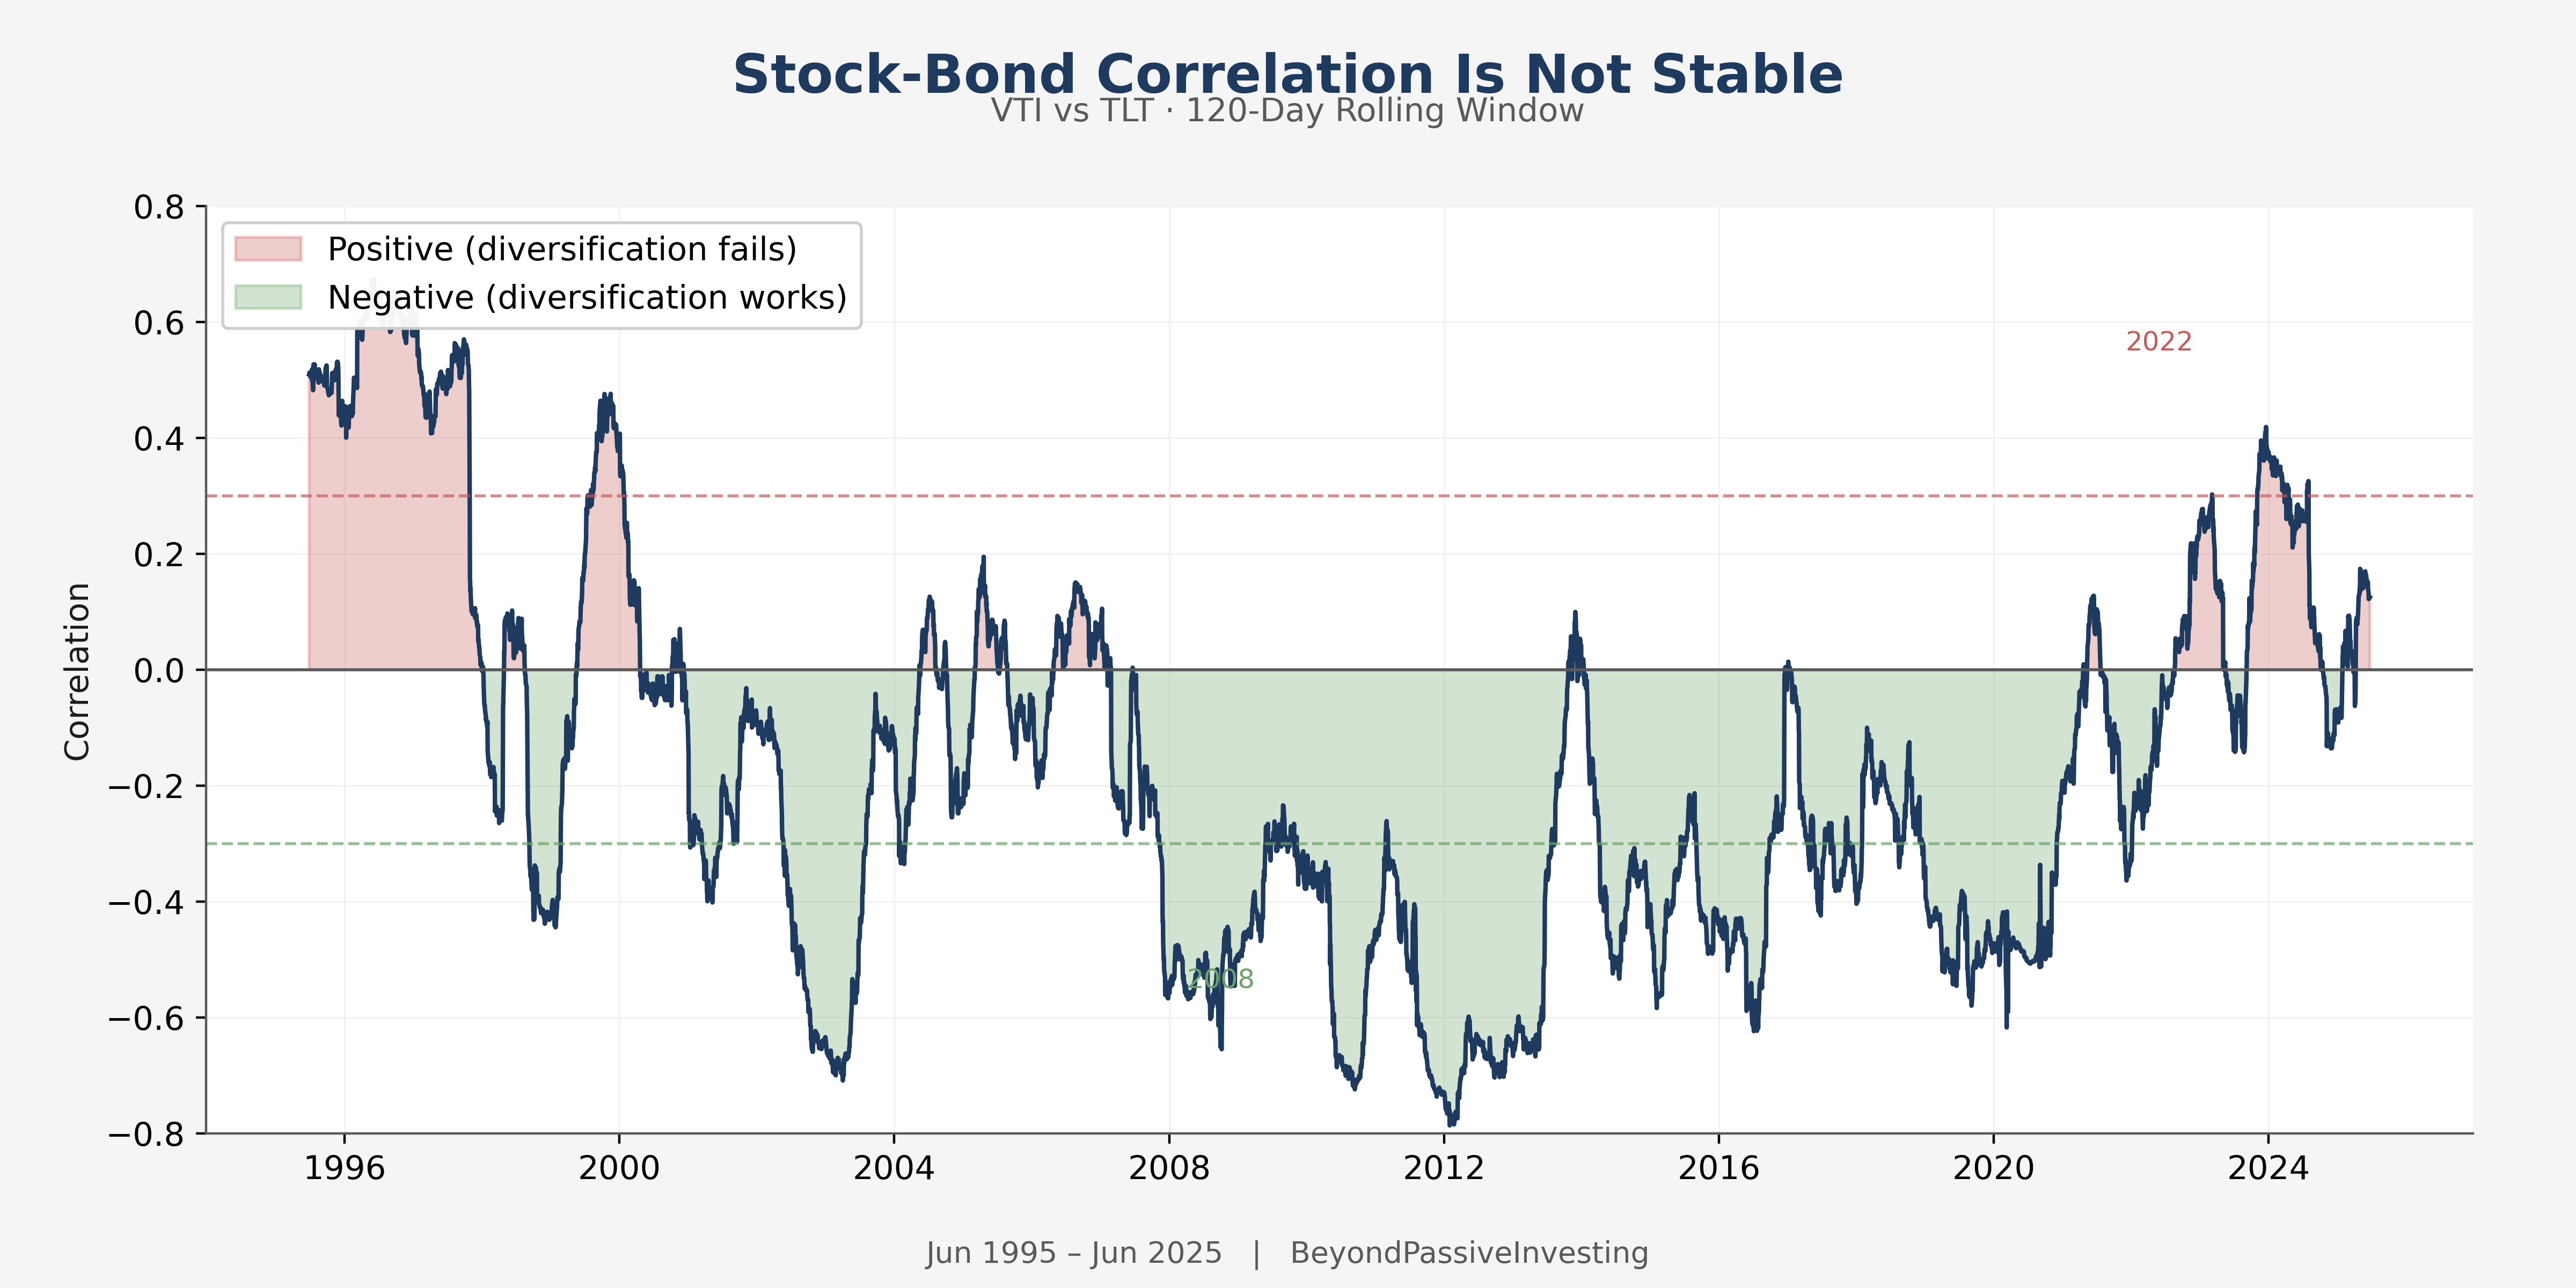
During deflationary scares and flight-to-safety episodes, bonds rally when stocks crash—this is the world the 60/40 portfolio was designed for. But during inflationary periods, both asset classes can decline together. In 2022, rising rates crushed bond prices while simultaneously pressuring equity valuations. The correlation turned sharply positive, and the hedge became a liability.
Looking at the full history, stocks and bonds have moved together roughly 27% of the time. They have been strongly correlated—above +0.3—about 11% of the time. These are not tail events; they are recurring features of the macroeconomic landscape. A portfolio that only works in three out of four economic environments has a structural weakness that will eventually bite you.
Adding a Third Pillar
The most straightforward improvement to 60/40 is adding an asset class that thrives in exactly those regimes where stocks and bonds both struggle. Gold has historically served this role—it tends to perform well during inflationary periods and times when investors lose confidence in financial assets.
Consider a simple equal-weight approach: one-third stocks, one-third bonds, one-third gold, rebalanced monthly.
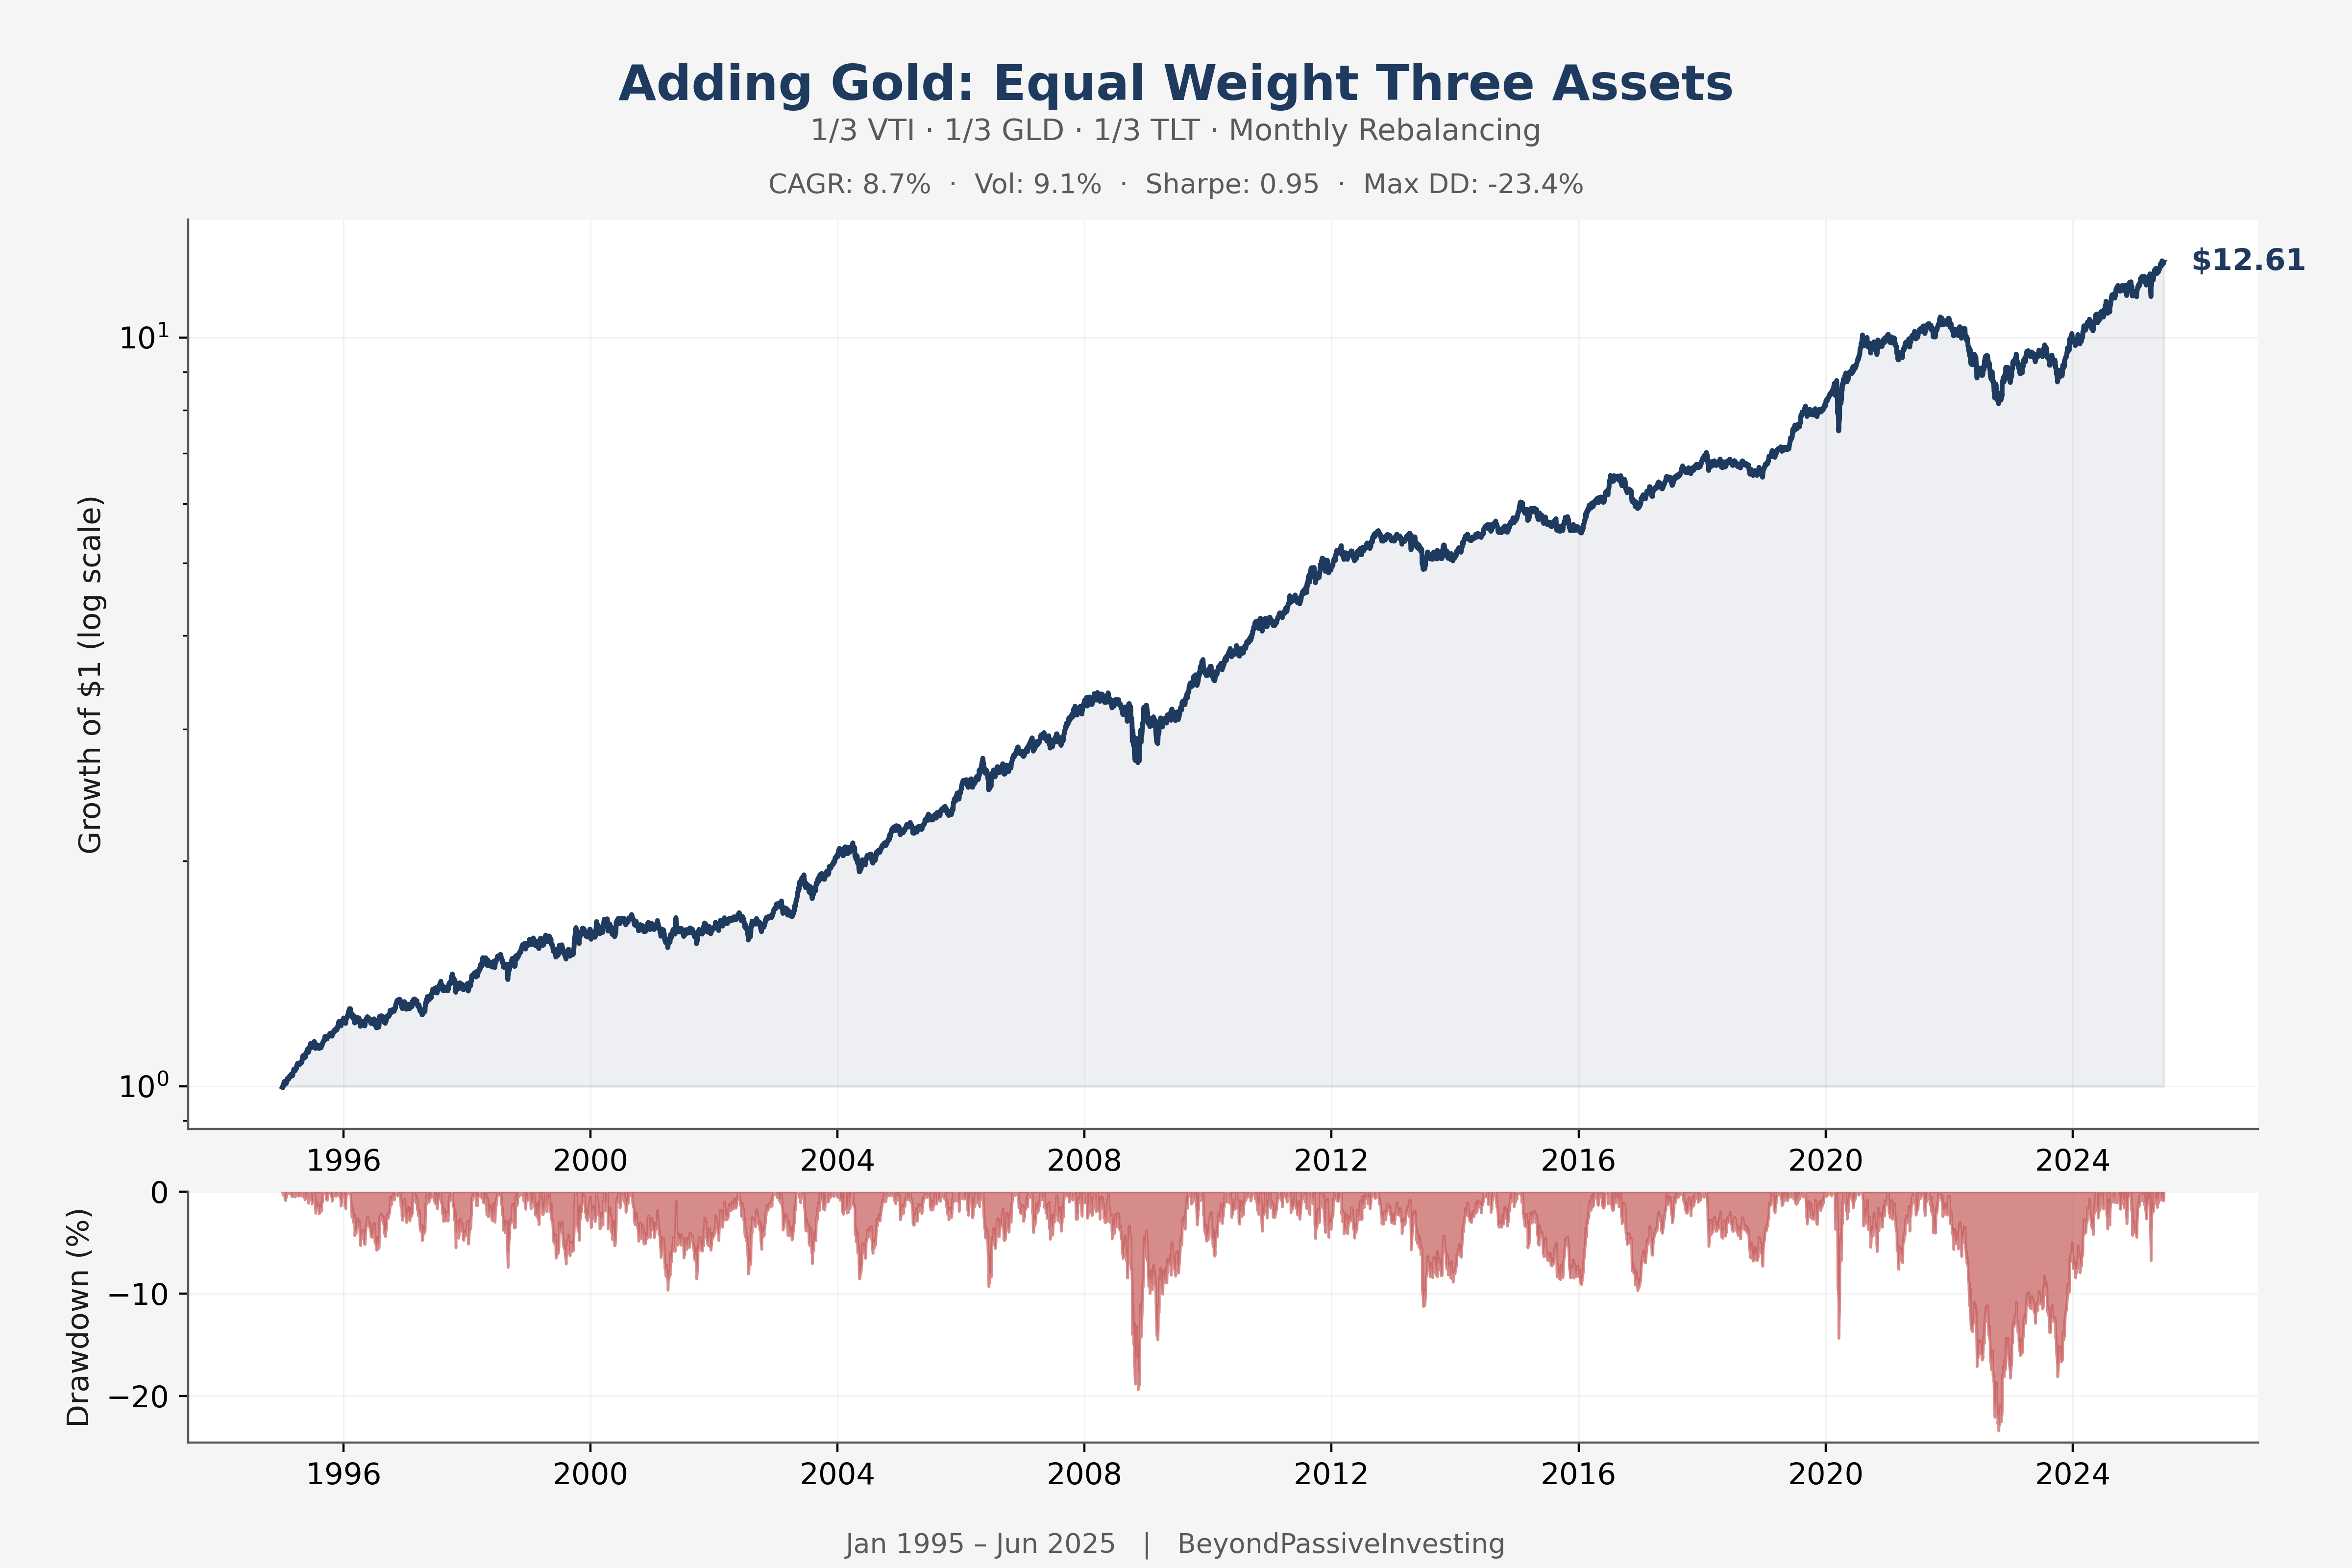
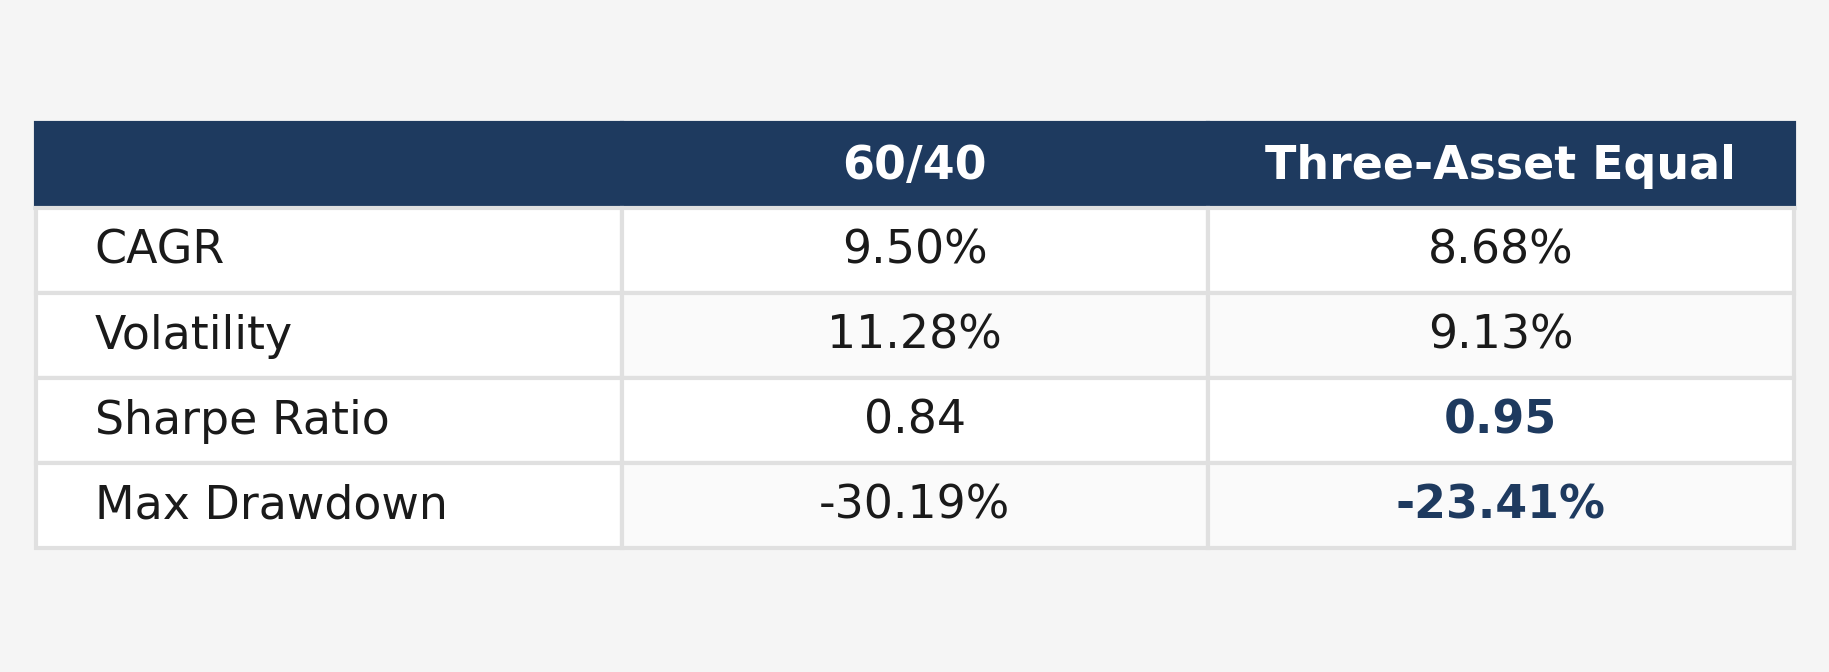
The CAGR drops by about 80 basis points, which is the price you pay for true regime diversification. But the risk-adjusted picture improves meaningfully: volatility falls from 11.3% to 9.1%, the Sharpe ratio rises from 0.84 to 0.95, and the maximum drawdown shrinks by nearly seven percentage points. You are getting more return per unit of risk taken, and the worst-case scenario becomes substantially less severe.
Weighting by Risk, Not by Capital
Equal weighting across asset classes is a reasonable first step, but it ignores an important asymmetry: stocks are roughly twice as volatile as bonds. In a one-third allocation to each asset, equities still dominate the portfolio’s risk budget. You have diversified your capital, but you have not truly diversified your risk.
The solution is inverse volatility weighting: instead of allocating equal dollars, you allocate equal risk. Assets with lower volatility receive higher weights; assets with higher volatility receive lower weights. Each month, you measure trailing 63-day volatility and rebalance accordingly.
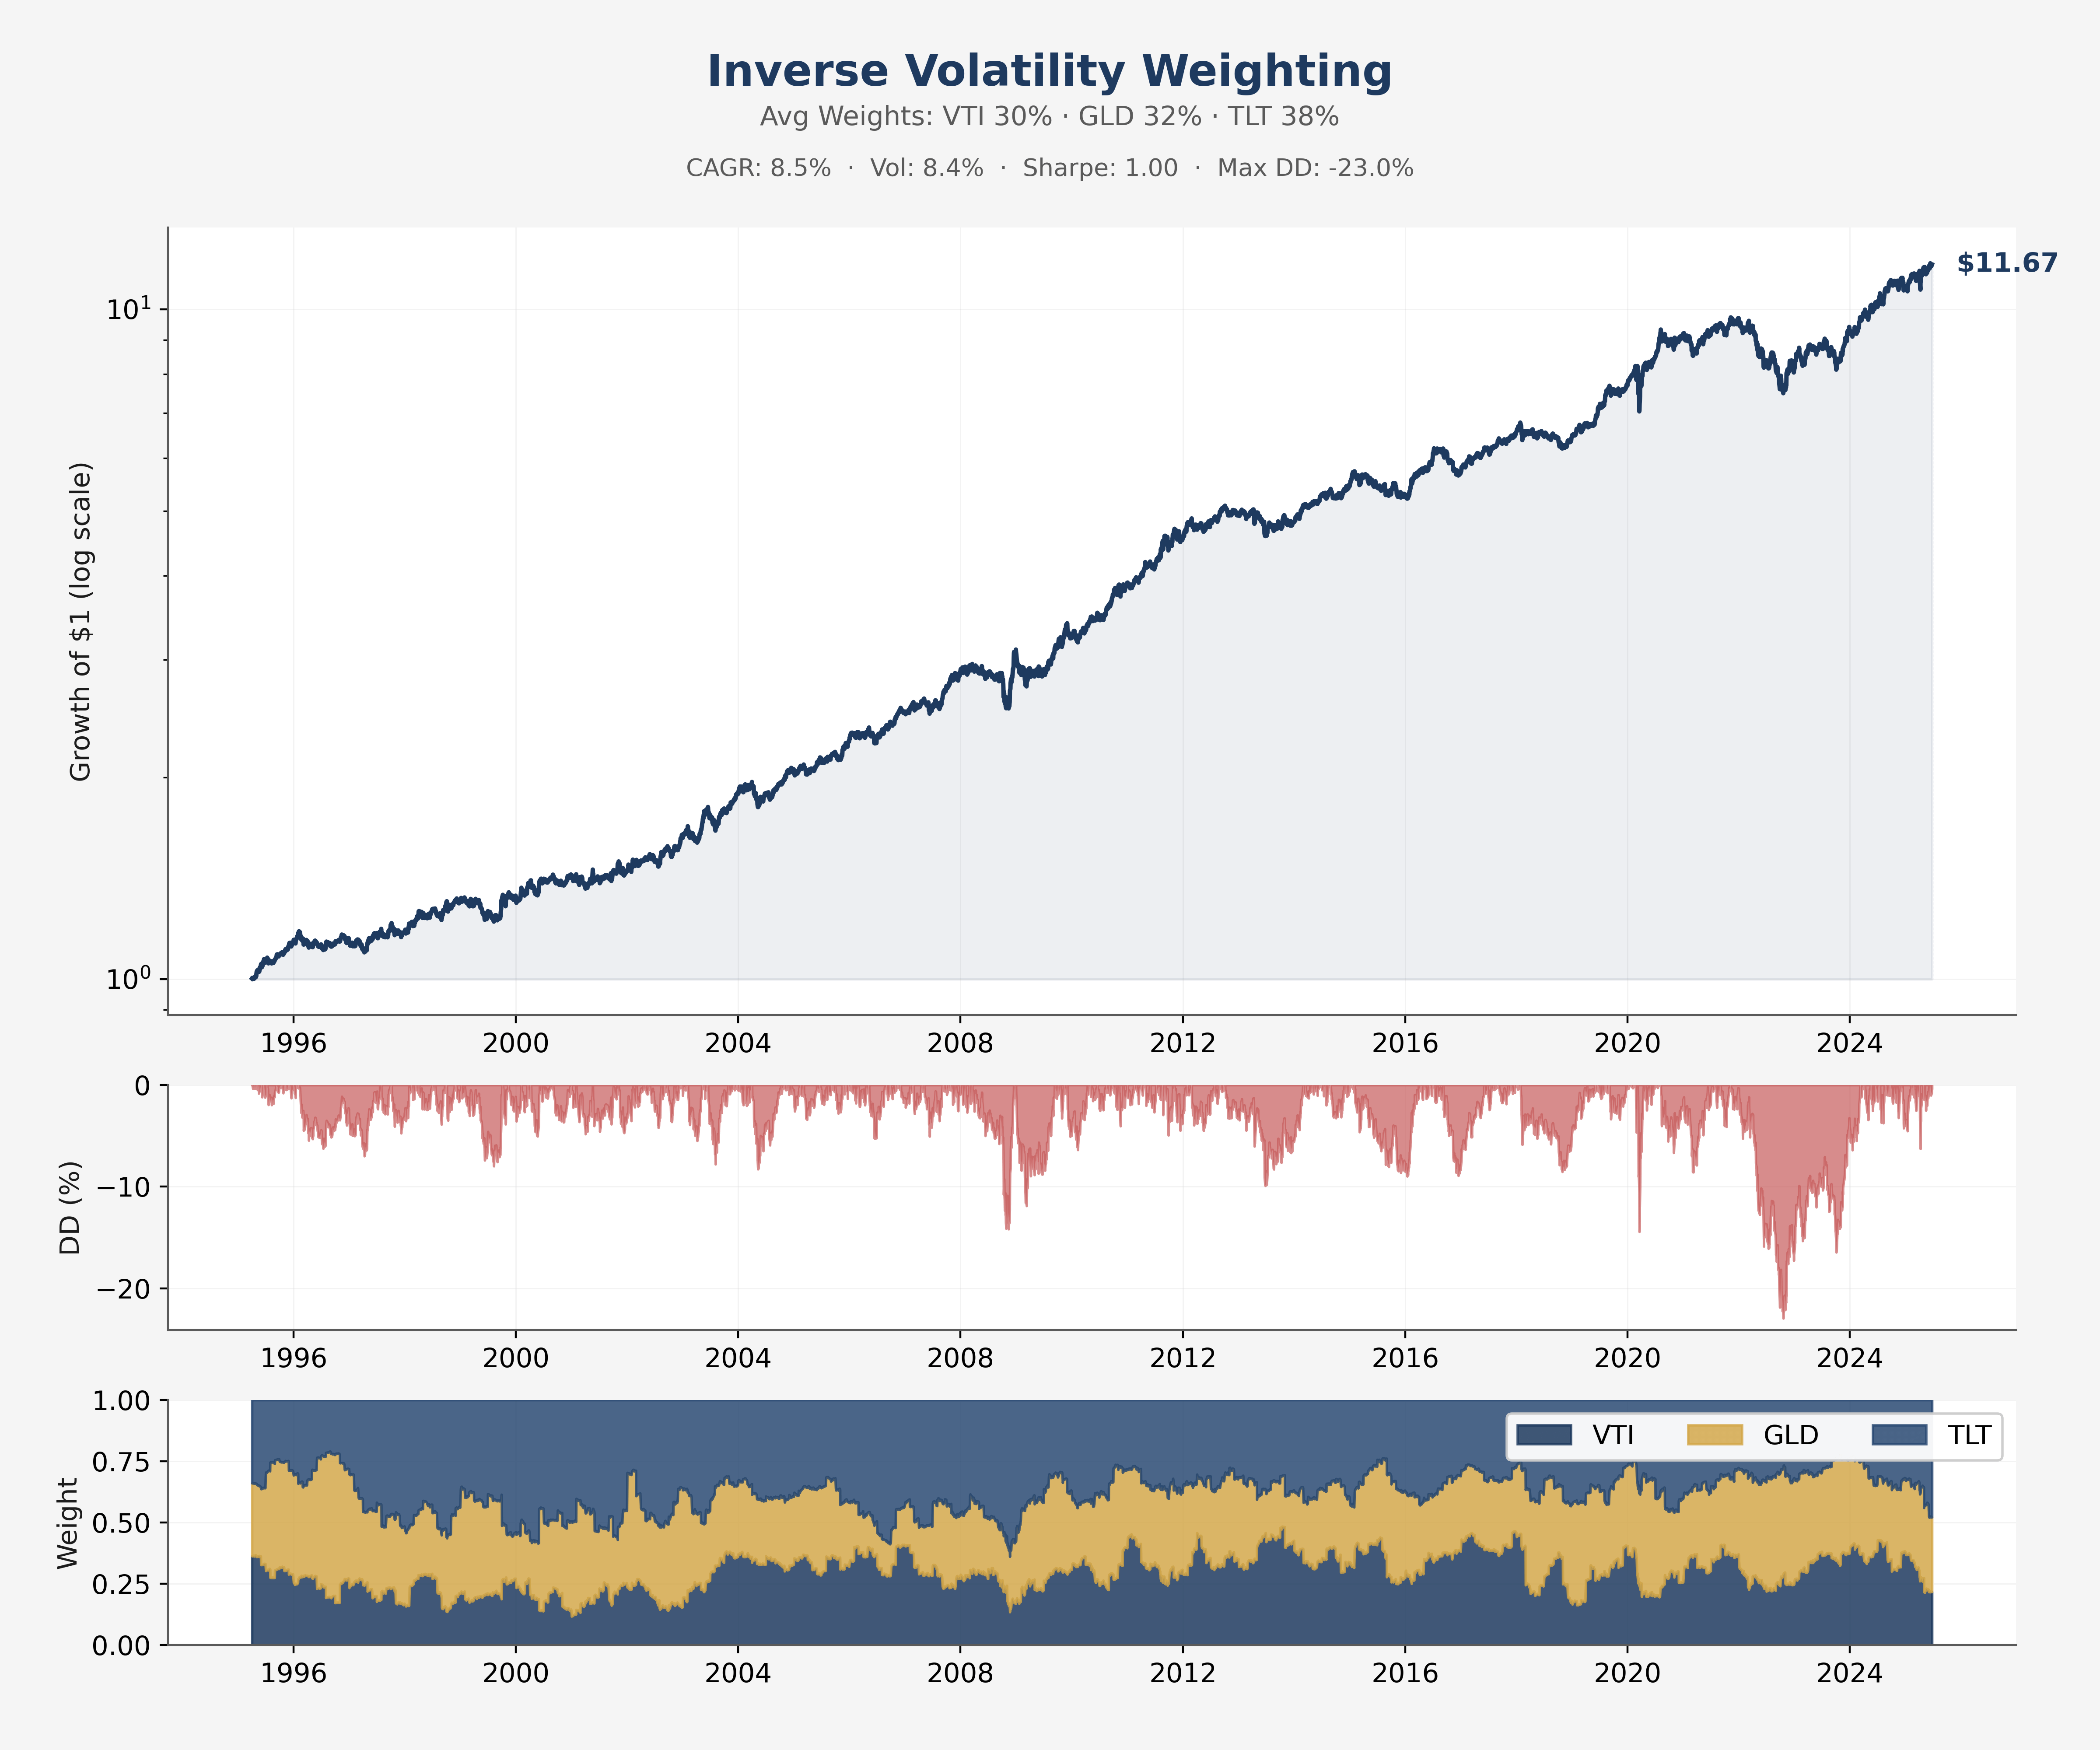
The average weights work out to roughly 30% stocks, 32% gold, and 38% bonds. This is not an arbitrary choice; it reflects each asset’s historical risk contribution. The result is a Sharpe ratio of exactly 1.00—a meaningful improvement in risk-adjusted terms—with slightly smaller drawdowns than equal weighting.
The Predictability of Volatility
Here is something that most investors do not appreciate: while returns are essentially unpredictable, volatility is highly persistent. High-volatility periods tend to cluster together—if volatility spiked yesterday, it will likely remain elevated today and tomorrow. This is one of the most robust empirical findings in finance, and it has practical implications.
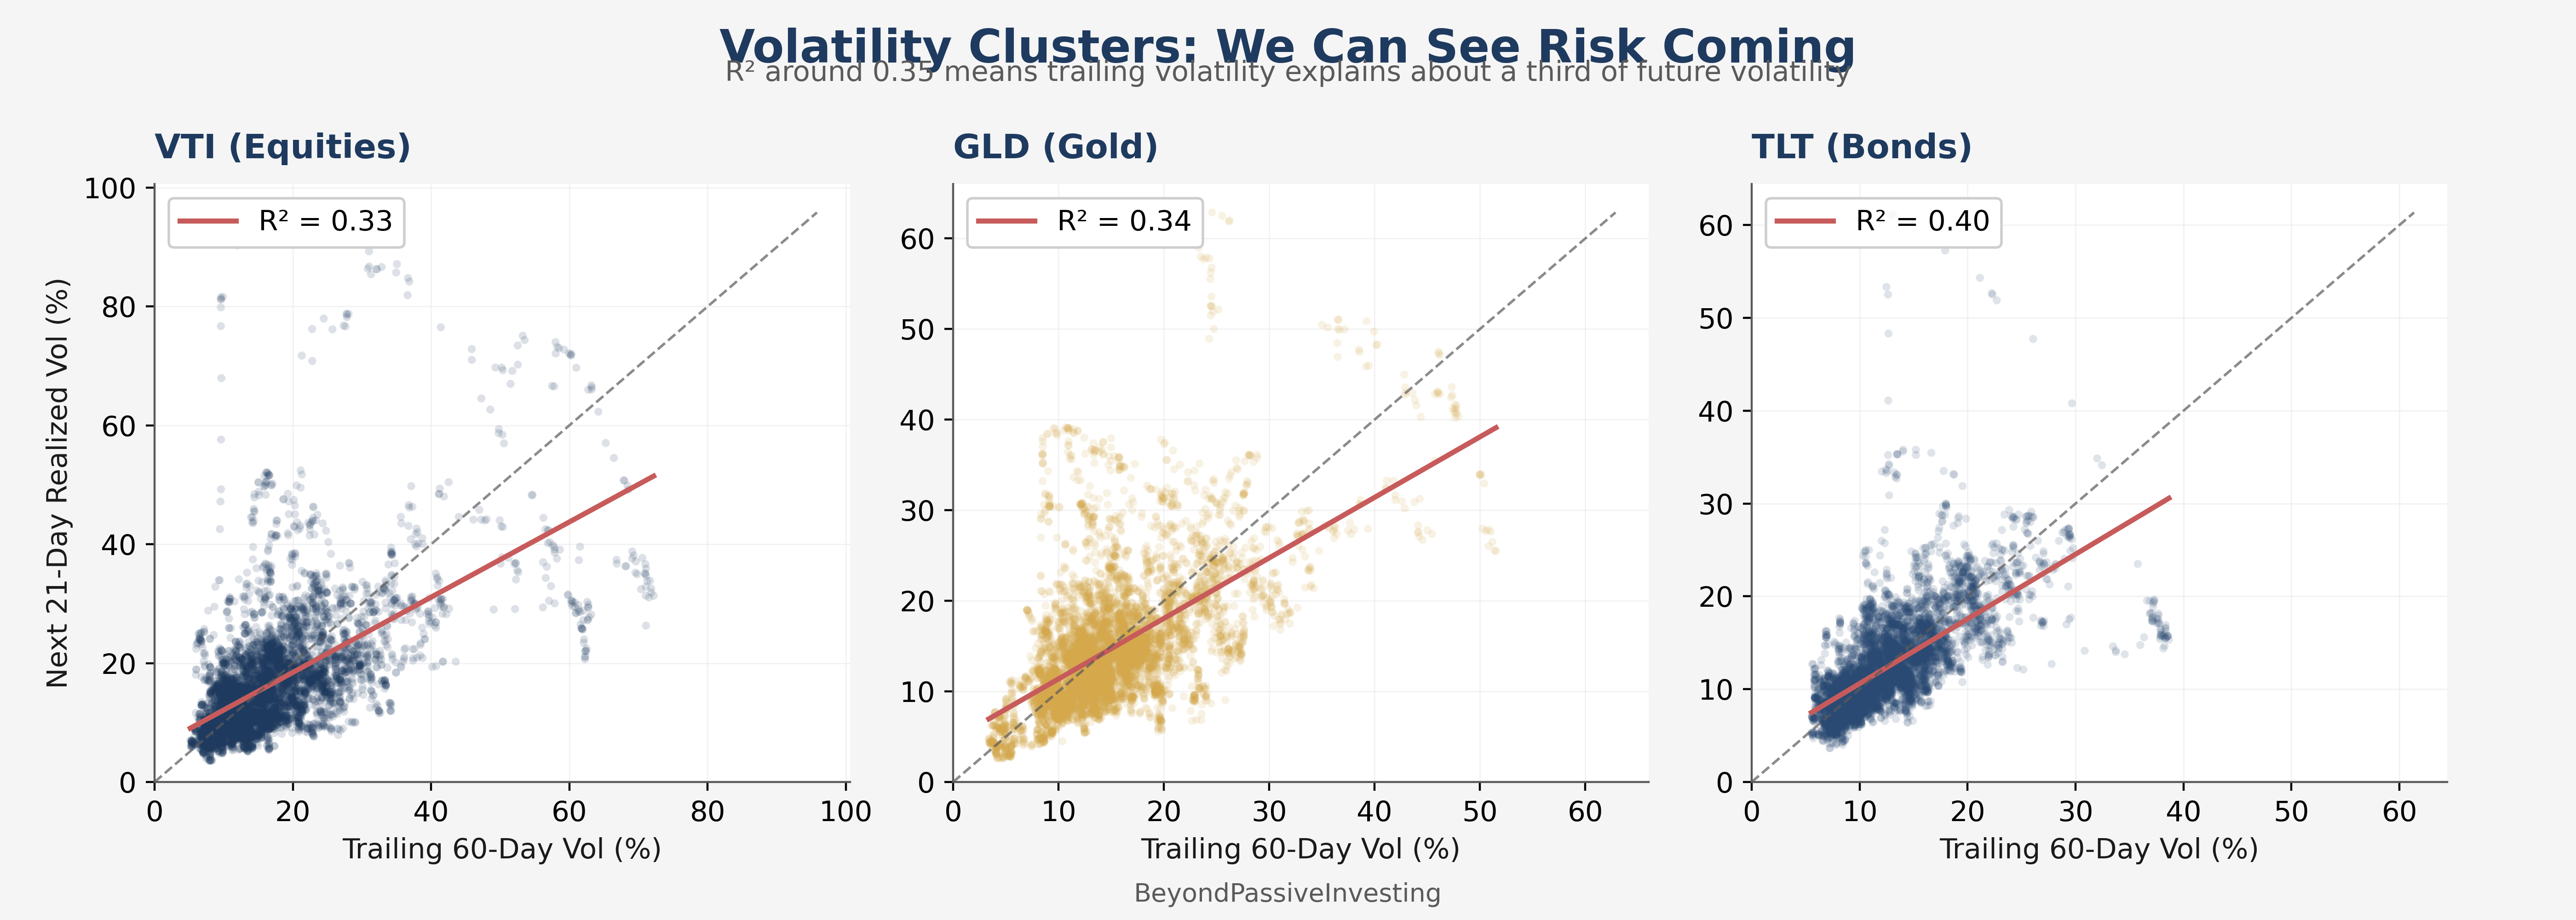
The R² values of 0.33 to 0.40 mean that trailing volatility explains roughly a third of the variance in future volatility. In a world where return forecasting is essentially futile, this is a remarkably strong signal. And it suggests a practical strategy: if you know that volatility is currently elevated, you can reasonably expect it to remain elevated in the near term. Rather than riding out the storm fully invested, you can reduce exposure during high-risk periods and return to full investment when conditions normalize.
This is not market timing in the traditional sense. You are not trying to predict whether prices will go up or down. You are simply acknowledging that a 1% daily move means very different things in different volatility regimes, and adjusting your exposure accordingly.
The Complete System
The final portfolio combines everything: three diversified assets, inverse volatility weighting for allocation, and a volatility target overlay on the entire portfolio.
The rules are simple: target 8% portfolio volatility, scale down exposure when trailing 63-day portfolio volatility exceeds 8.5%, no leverage (if vol is below target, stay fully invested), and execute daily.
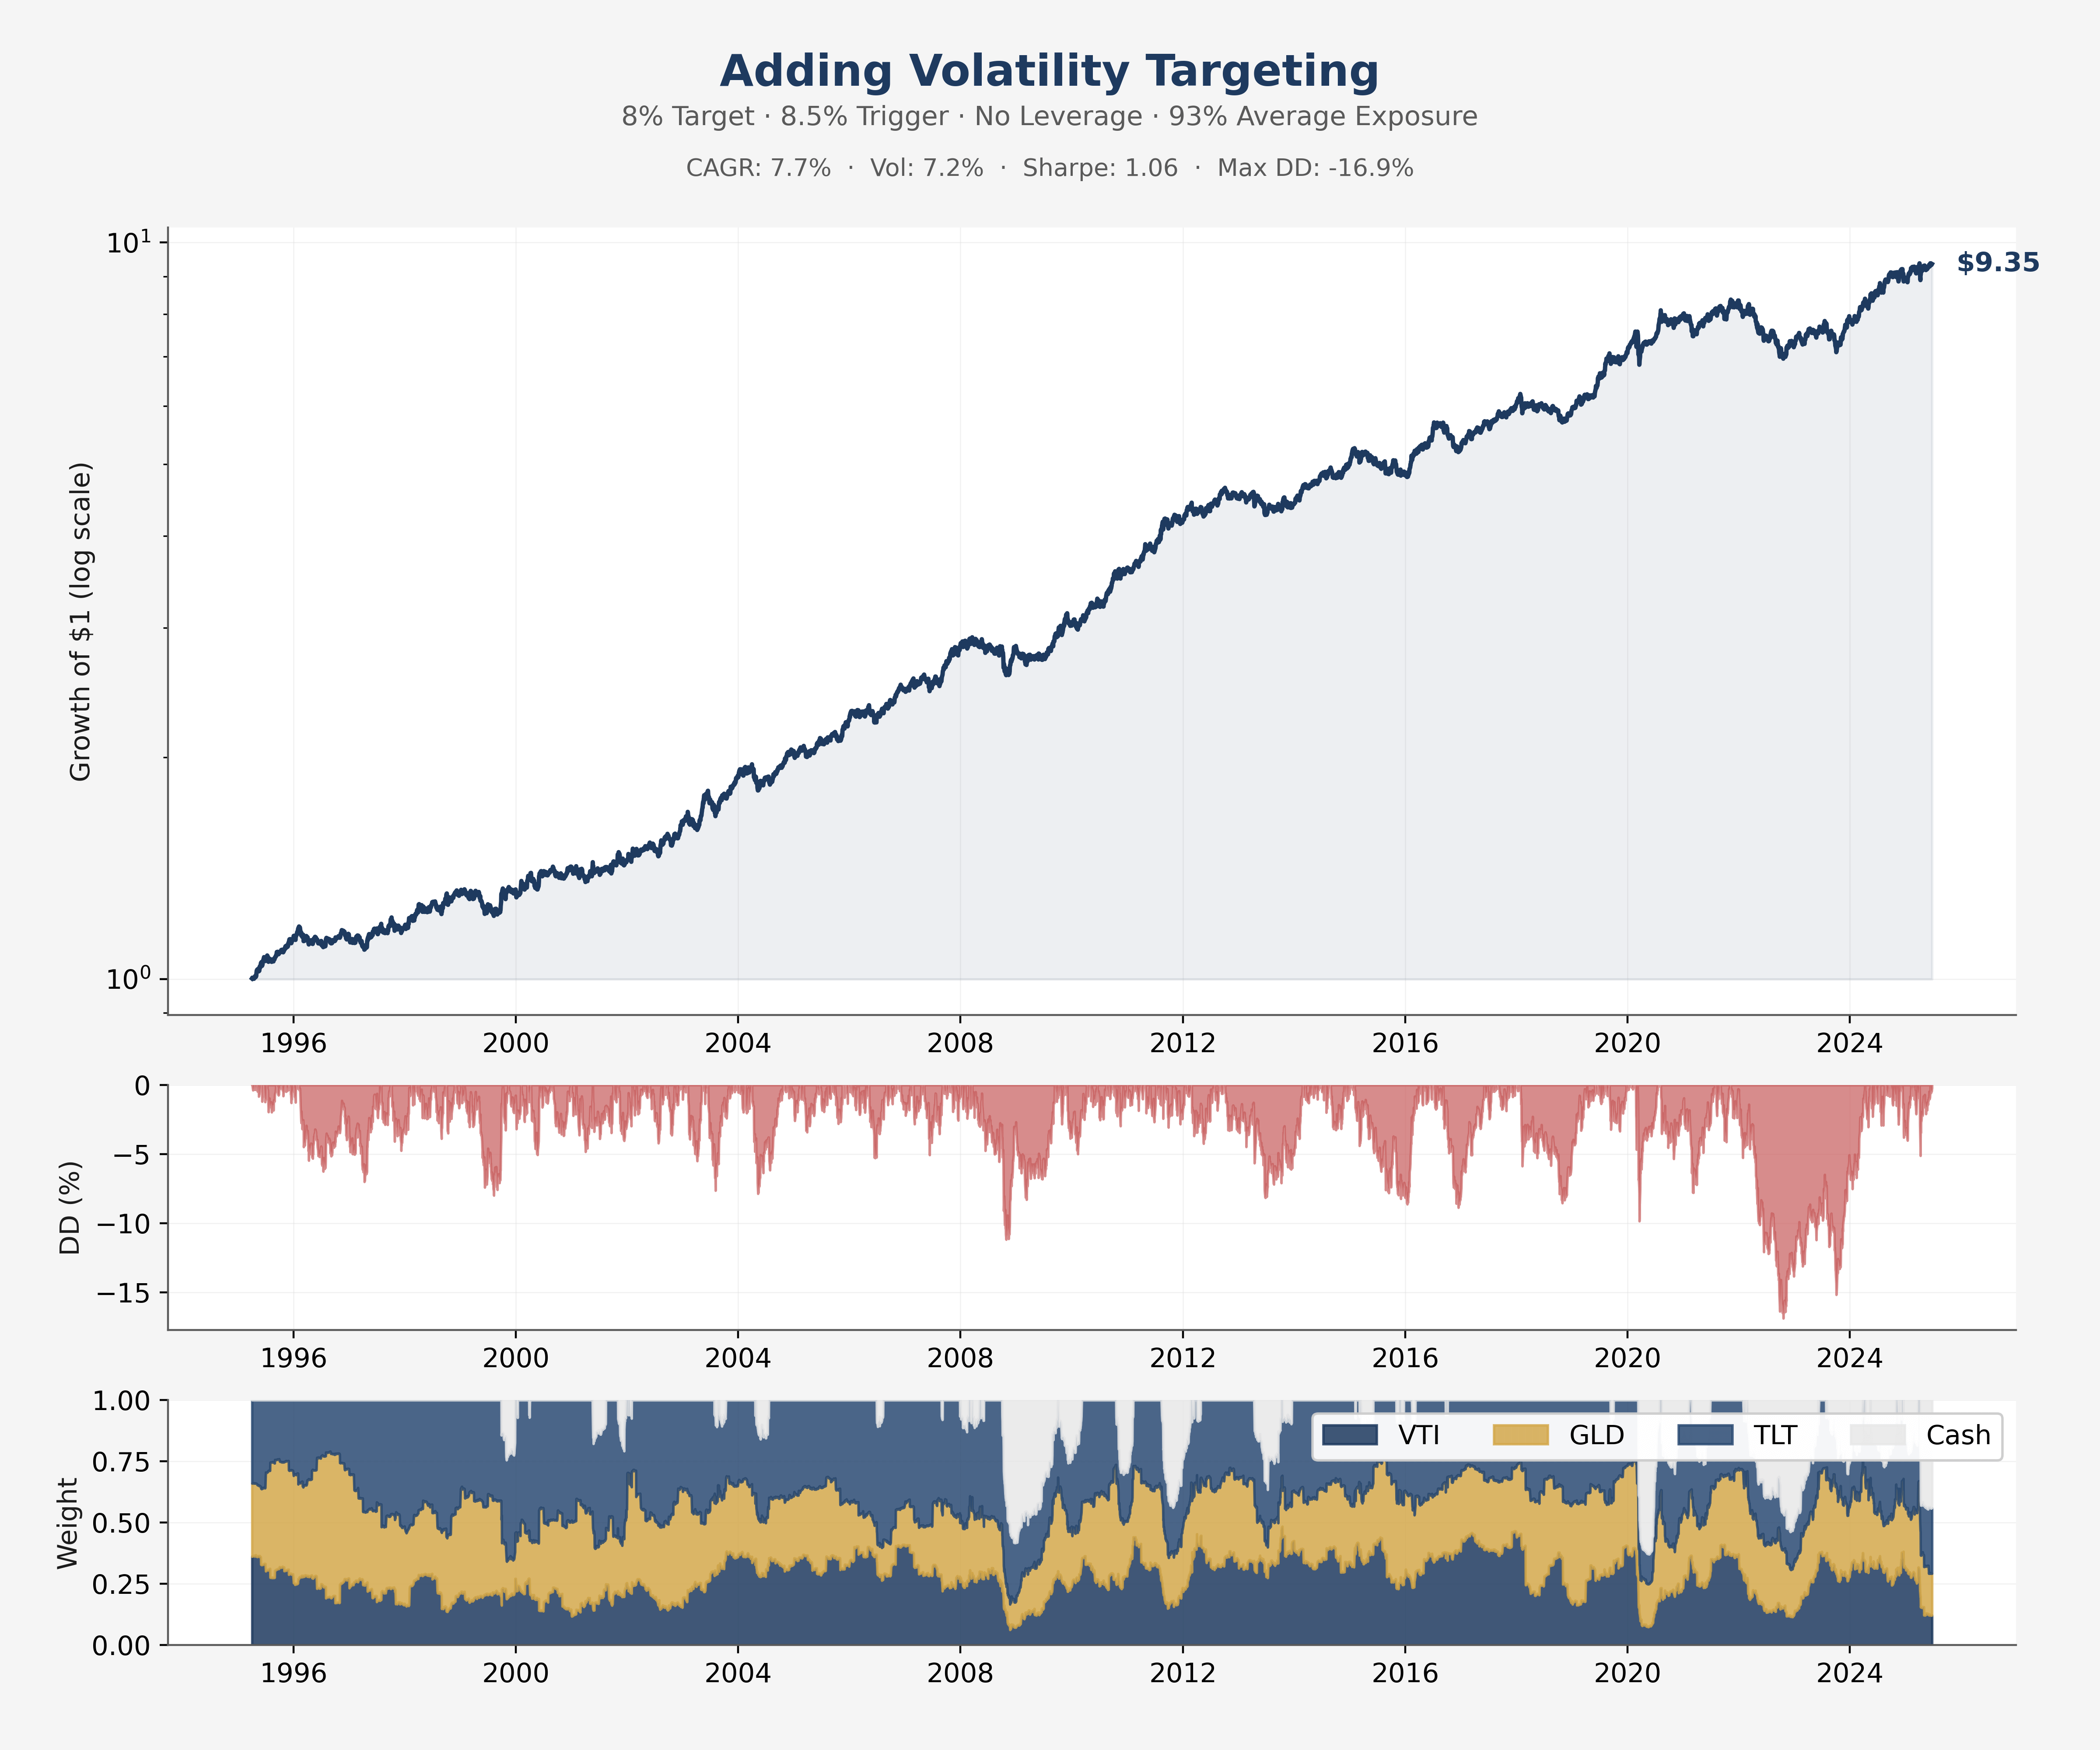
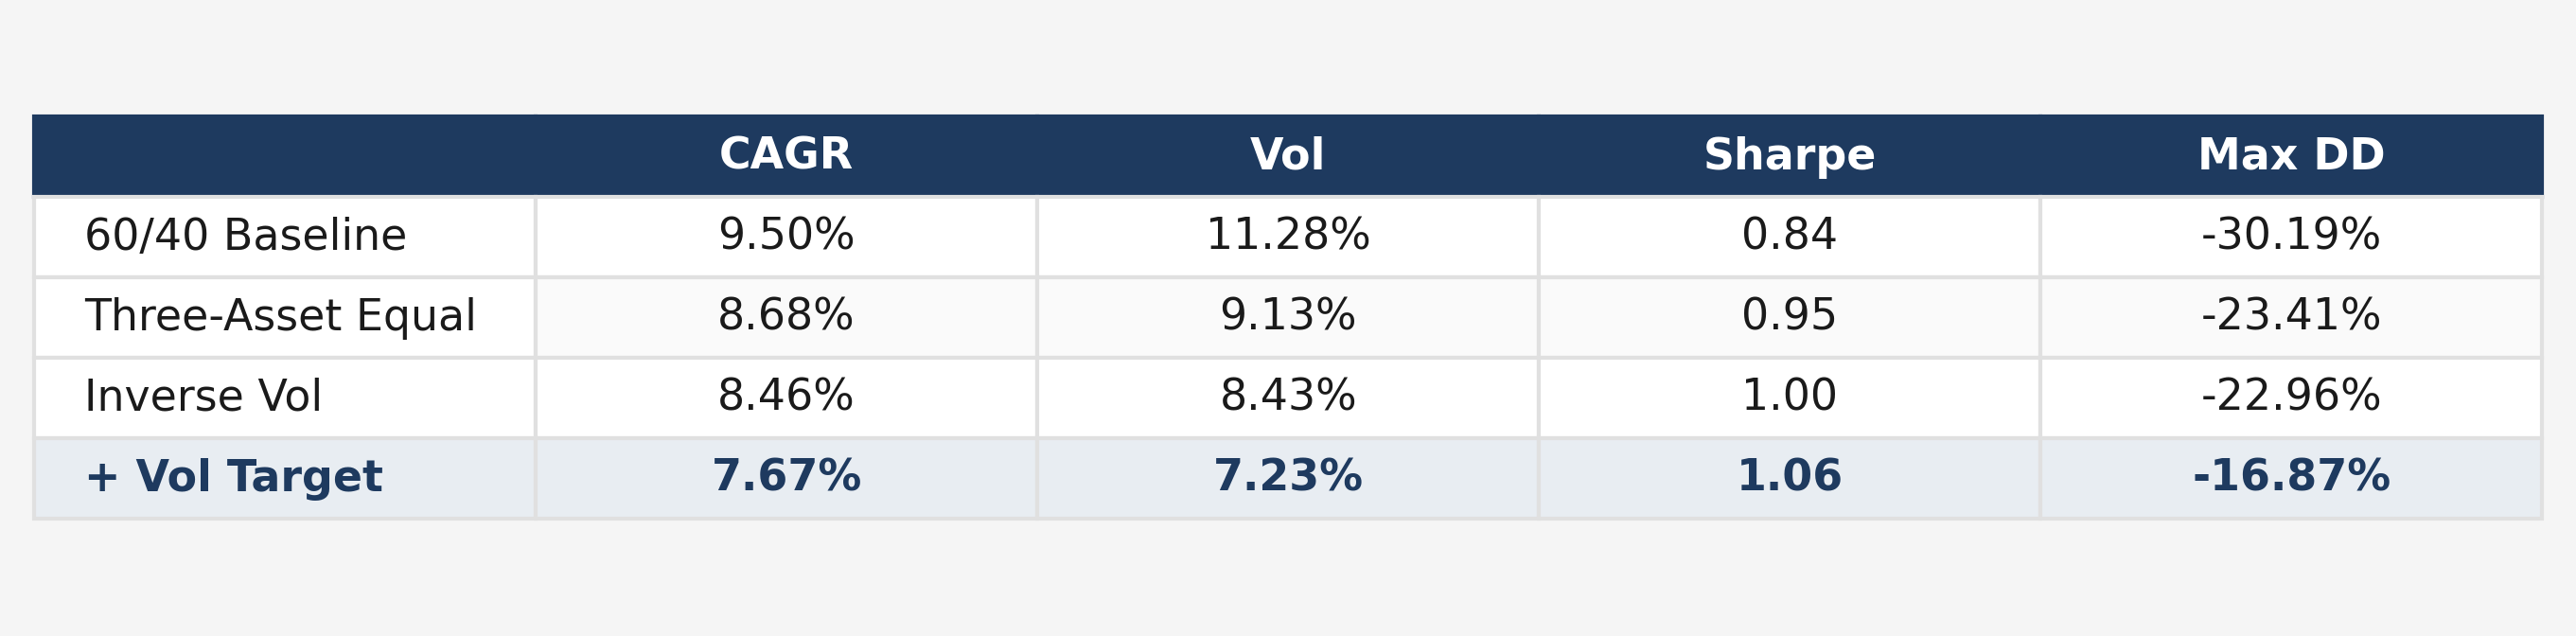
The maximum drawdown drops from 30% to under 17%—a reduction of more than 40%. The Sharpe ratio improves from 0.84 to 1.06. Yes, the CAGR declines from 9.5% to 7.7%, but consider what you are comparing: the vol-targeted portfolio delivers those returns with vastly less risk. If you wanted to match the 60/40’s volatility level, you could apply modest leverage to the vol-targeted portfolio and would likely beat its returns outright.
The portfolio spends about 69% of its time fully invested. You are not perpetually sitting in cash waiting for the perfect moment—you are simply stepping back during storms and returning when conditions normalize.
Beyond Passive
Nothing in this approach requires predicting market direction. You are not calling tops, picking sectors, or timing macro announcements. The strategy uses only information that is knowable today—current volatilities, current correlations—to make systematic allocation decisions.
The evolution from 60/40 involves two conceptual moves. First, you diversify across asset classes that respond to different economic regimes, ensuring that you are never completely wrong-footed when the environment shifts. Second, you actively manage risk using the fact that volatility is persistent and forecastable, keeping your actual risk experience consistent through time.
This is what going beyond passive means: not trying to be smarter than the market about where prices are headed, but refusing to take on risks that you can see coming and measure in real time. The Pantoffelportfolio is a reasonable starting point. But if you are willing to do a bit more work, the improvements in risk-adjusted returns are substantial.
Further Reading
Foundations of Risk Parity
Bridgewater Associates (2012). The All Weather Story. The definitive account of how Dalio developed the four economic regimes framework and risk-balanced portfolio construction.
Prince, B. (2011). Risk Parity Is About Balance. Bridgewater Associates. Lays out the theoretical foundation for equalizing risk contributions across economic environments.
Maillard, S., Roncalli, T., & Teiletche, J. (2010). “On the Properties of Equally Weighted Risk Contribution Portfolios.” Journal of Portfolio Management, 36(4), 60-70. The seminal academic paper formalizing equal risk contribution portfolio construction.
Volatility Targeting
Moreira, A. & Muir, T. (2017). “Volatility-Managed Portfolios.” Journal of Finance, 72(4), 1611-1644. Academic validation of volatility scaling improving risk-adjusted returns.
QuantPedia (2021). An Introduction to Volatility Targeting. Practical overview of volatility targeting variants including EWMA and GARCH approaches.
Adaptive Allocation
Butler, A., Philbrick, M., & Gordillo, R. (2015). Adaptive Asset Allocation: Dynamic Global Portfolios to Profit in Good Times – and Bad. ReSolve Asset Management. Comprehensive treatment of combining momentum, volatility weighting, and risk management.
Systematic Implementation
Carver, R. (2015). Systematic Trading. Harriman House. Position sizing, volatility targeting, and portfolio construction from a practitioner’s perspective.
Carver, R. (2017). Smart Portfolios. Harriman House. Inverse volatility weighting and handcrafting portfolio allocations.
Code Resources
Kapler, M. Systematic Investor Blog (2011-2015). systematicinvestor.wordpress.com. Extensive R code library for risk parity, cluster allocation, and backtesting—no longer maintained but remains one of the best open-source resources for portfolio construction.
Even as a German I never heard the word Pantoffelportfolio 😅. I like it a lot and have to borrow it 🤣.
This strategy is part of my portfolio too, but with some changes like equal-weighting.
Simple combination and nice derivation! One common risk factor is actually the USD, because all of these assets are denominated in this currency, so I wouldnt blindly implement it, but extend the Pantoffel-approach to other countries/currencies.