
A common piece of advice for any leveraged portfolio is to hold some long volatility on the side, a small position in VIX futures that pays when the stock market crashes. This article tests that advice on a risk-parity portfolio of stocks, bonds and gold and finds it wrong: VIX insures stocks, and this portfolio’s worst days are mostly not stock-market days. What protects it is a limit on how much exposure it may take, and that limit turns out to be a rule for executing the strategy rather than a change to it.
The portfolio
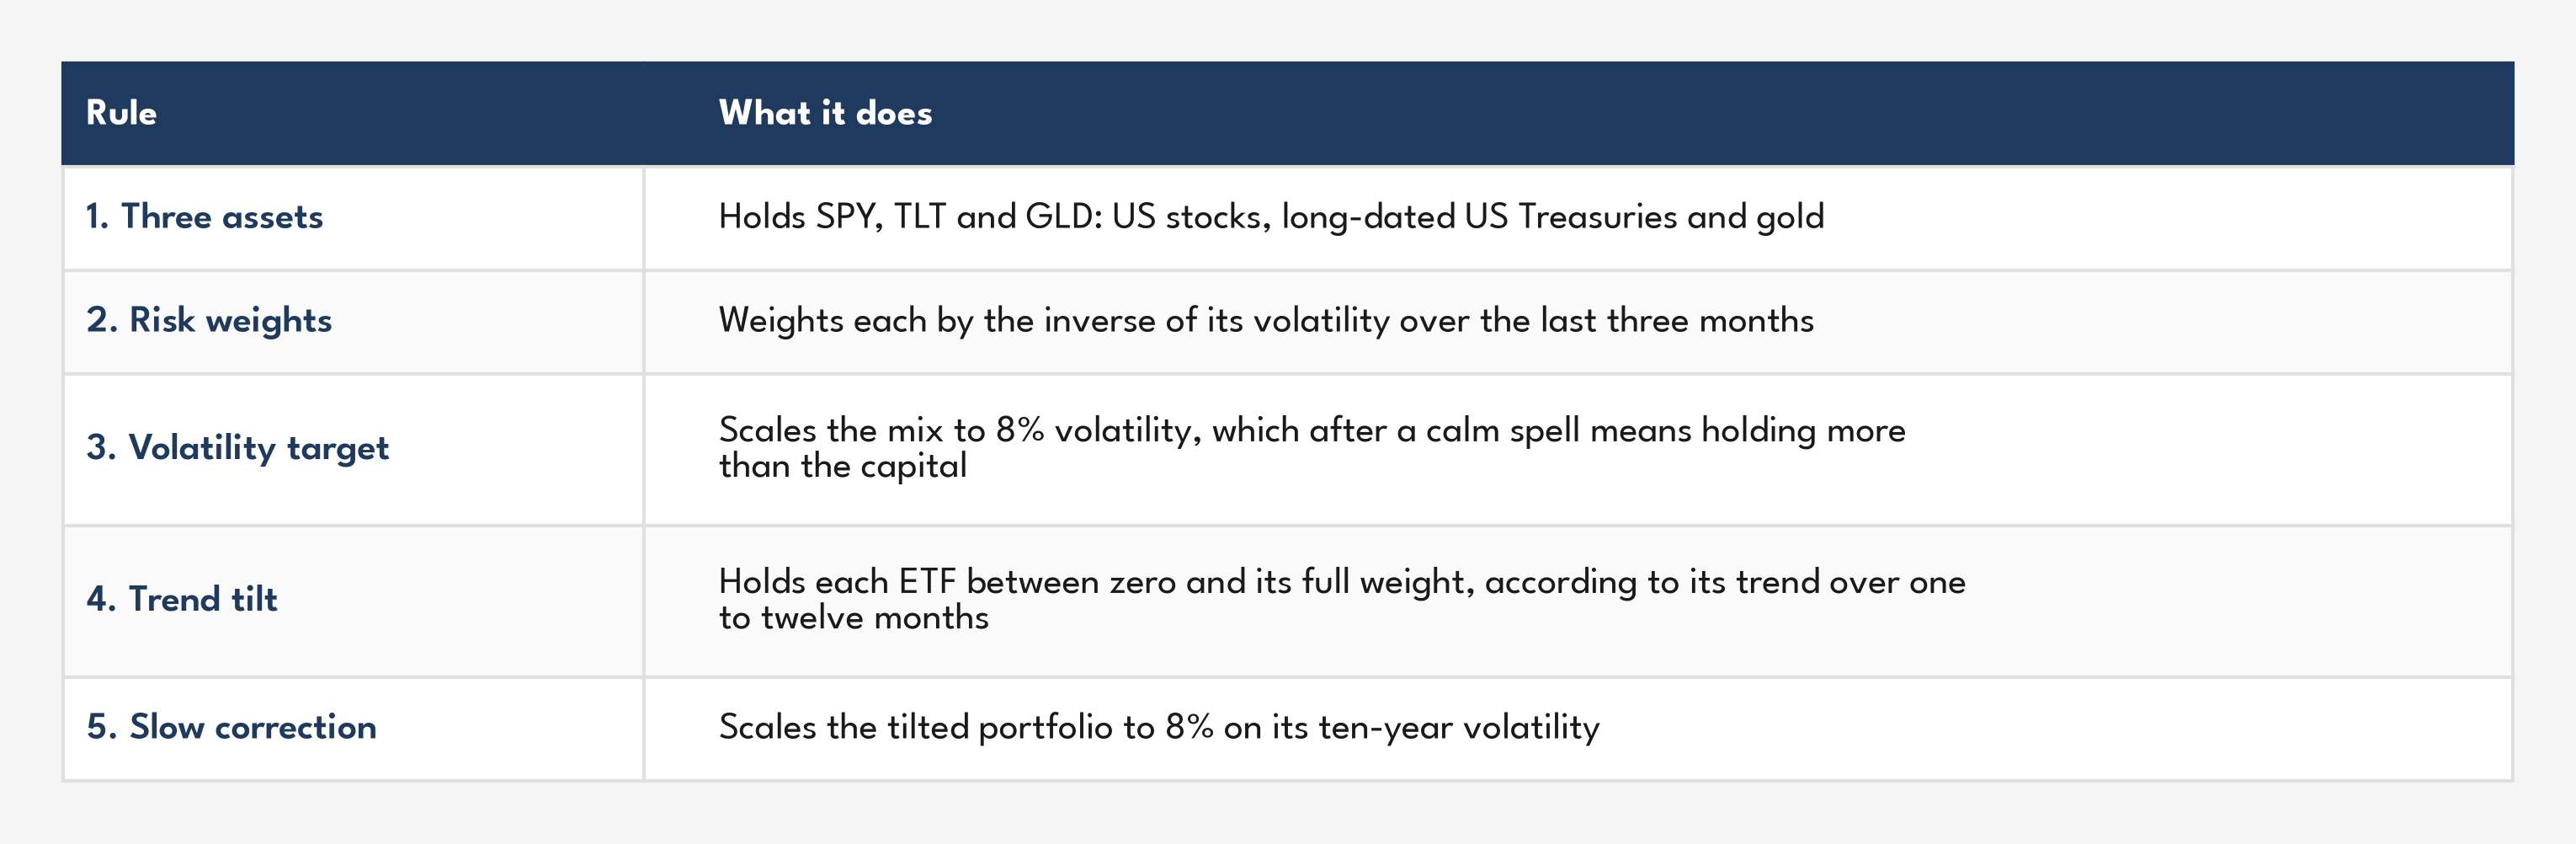
The portfolio is risk parity in its simplest form with a trend tilt on top, the poor man’s trend portfolio from the trend-following series. It follows five rules and never sells anything short:
Here is what it has done since 1970, simulated before 2005 with a long bond rebuilt from Treasury yields and gold at the London fix, and on the ETFs’ own prices since:
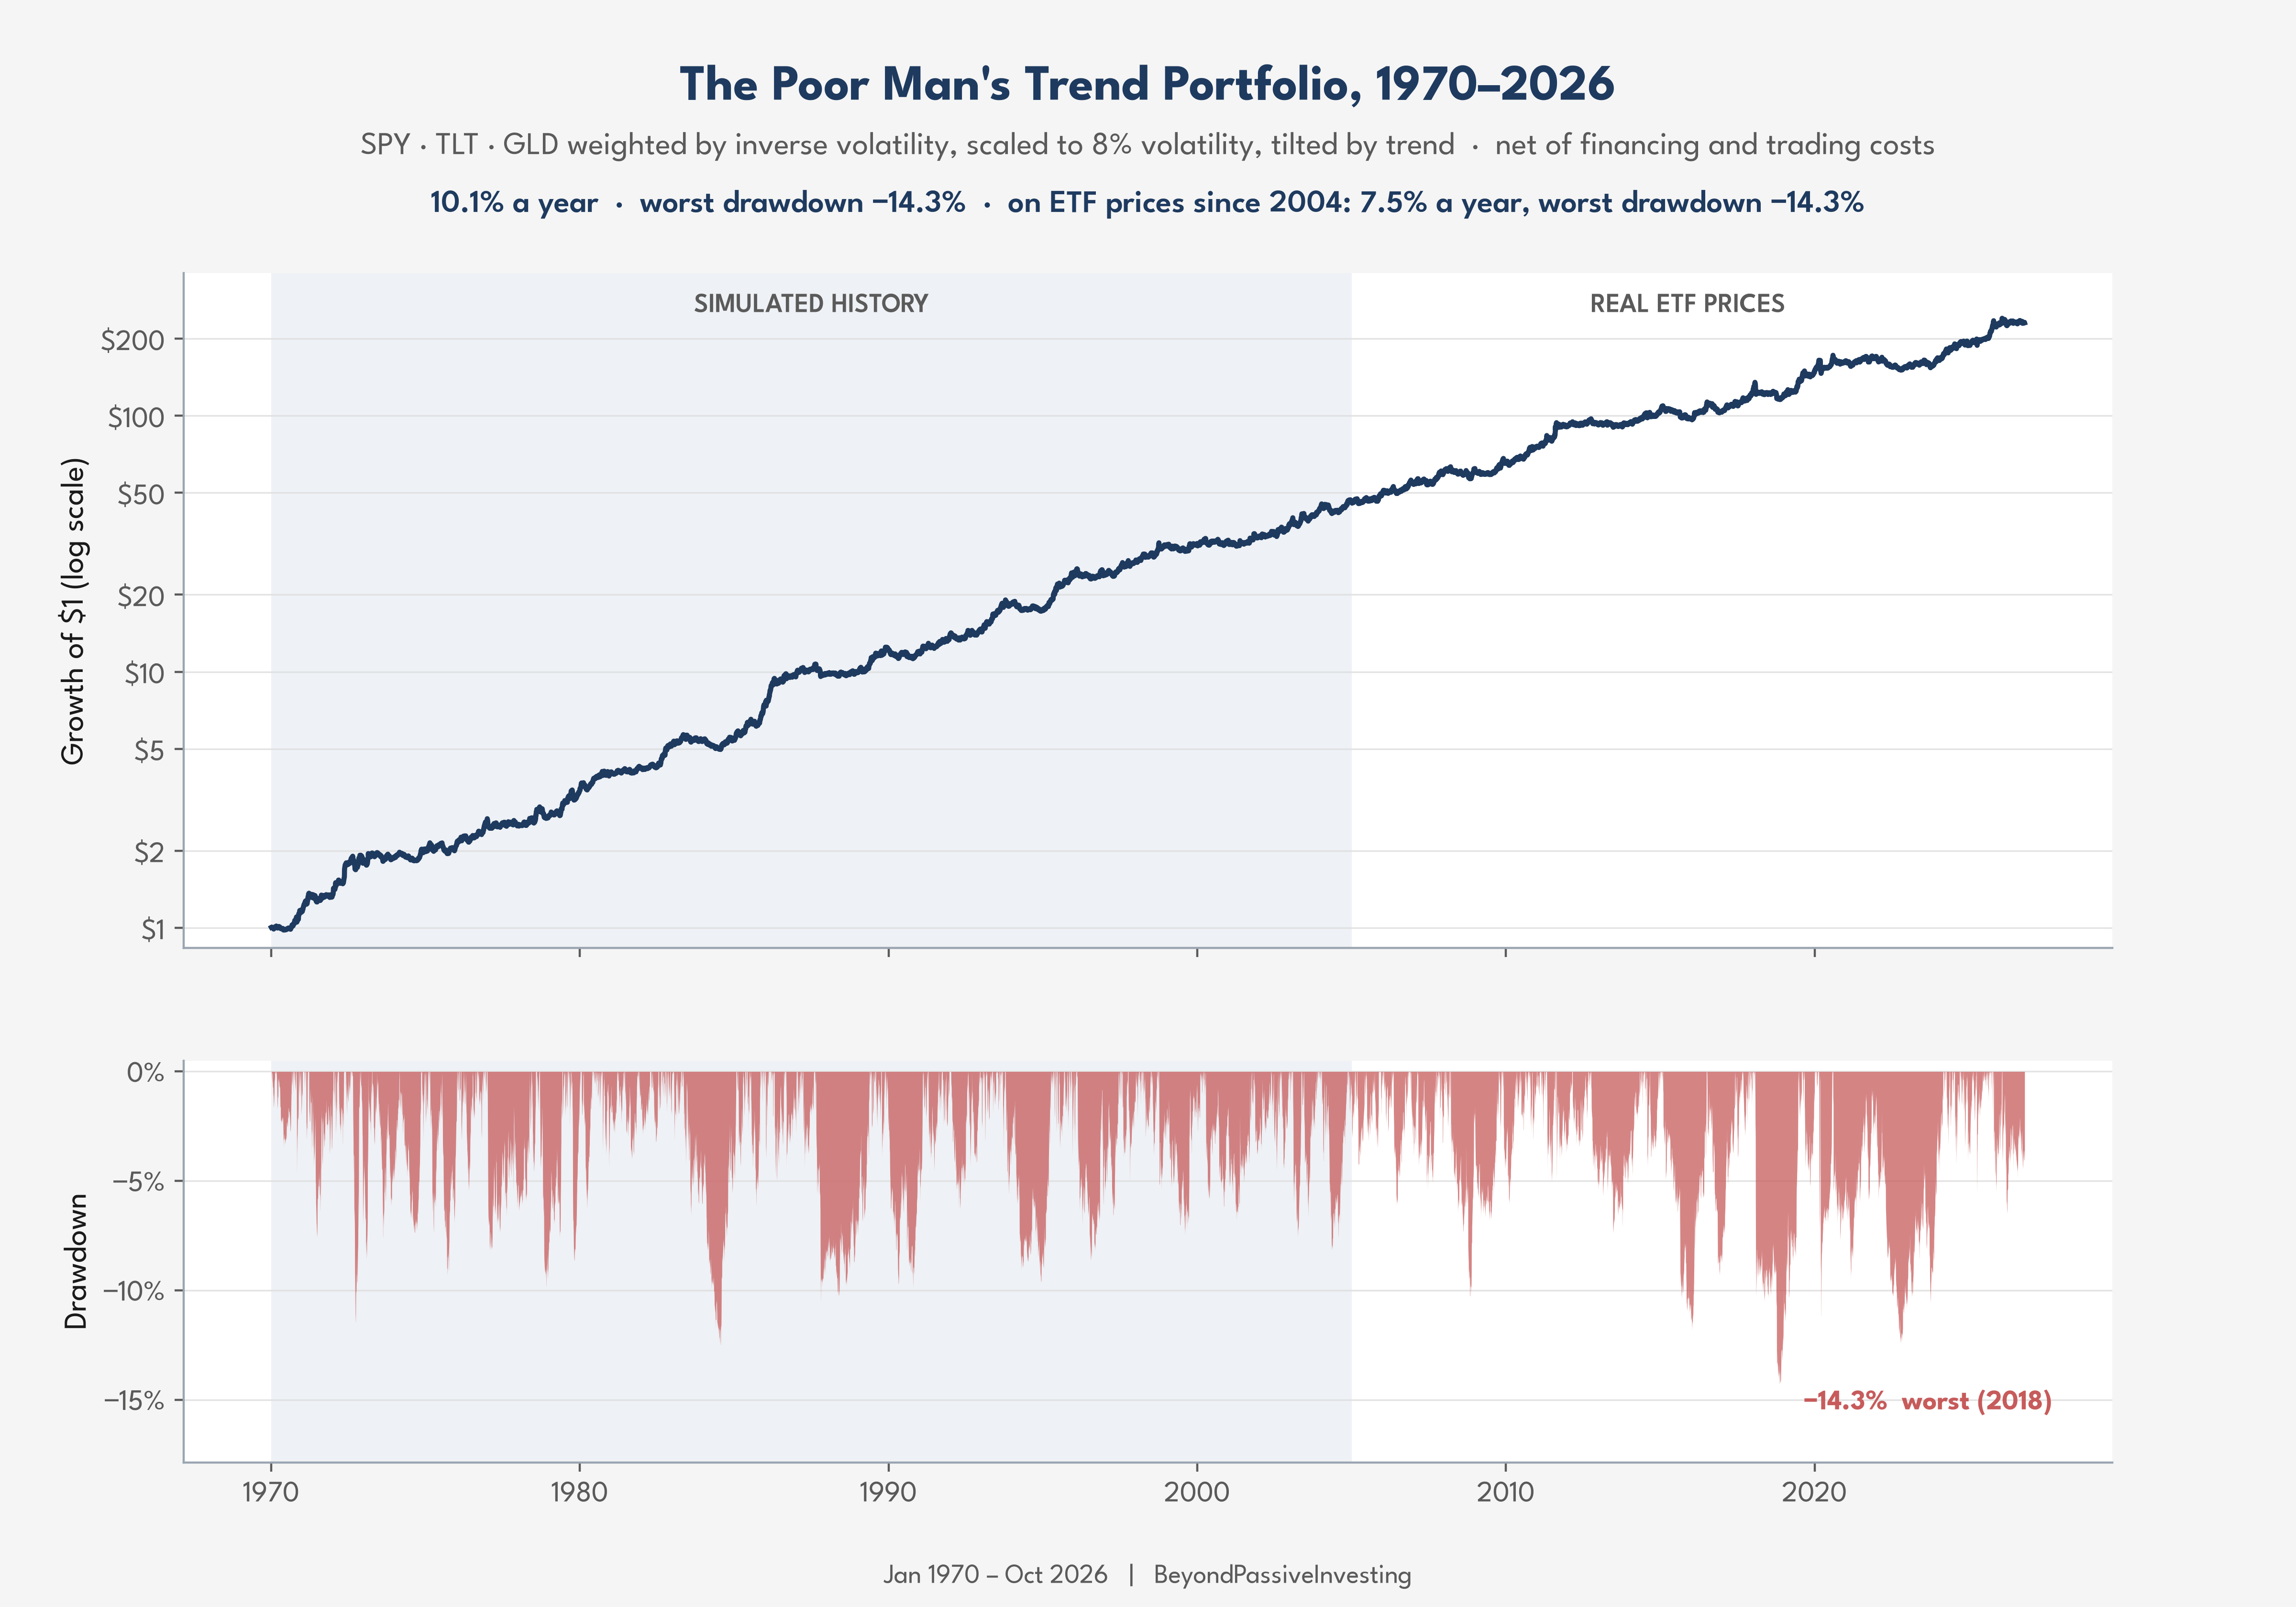
It compounds at 10.1% a year with a worst drawdown of 14.3% and a Sharpe ratio of 1.24, computed without a risk-free rate as in earlier articles; on ETF prices since 2004 the numbers are 7.5%, 14.3% and 0.94. The question is what to do about the left tail.
What the worst days are made of
Before buying insurance it is worth looking at the losses. Here are the portfolio’s 56 worst days on ETF prices, sorted by the ETF that lost most, with the days on which VIX jumped:
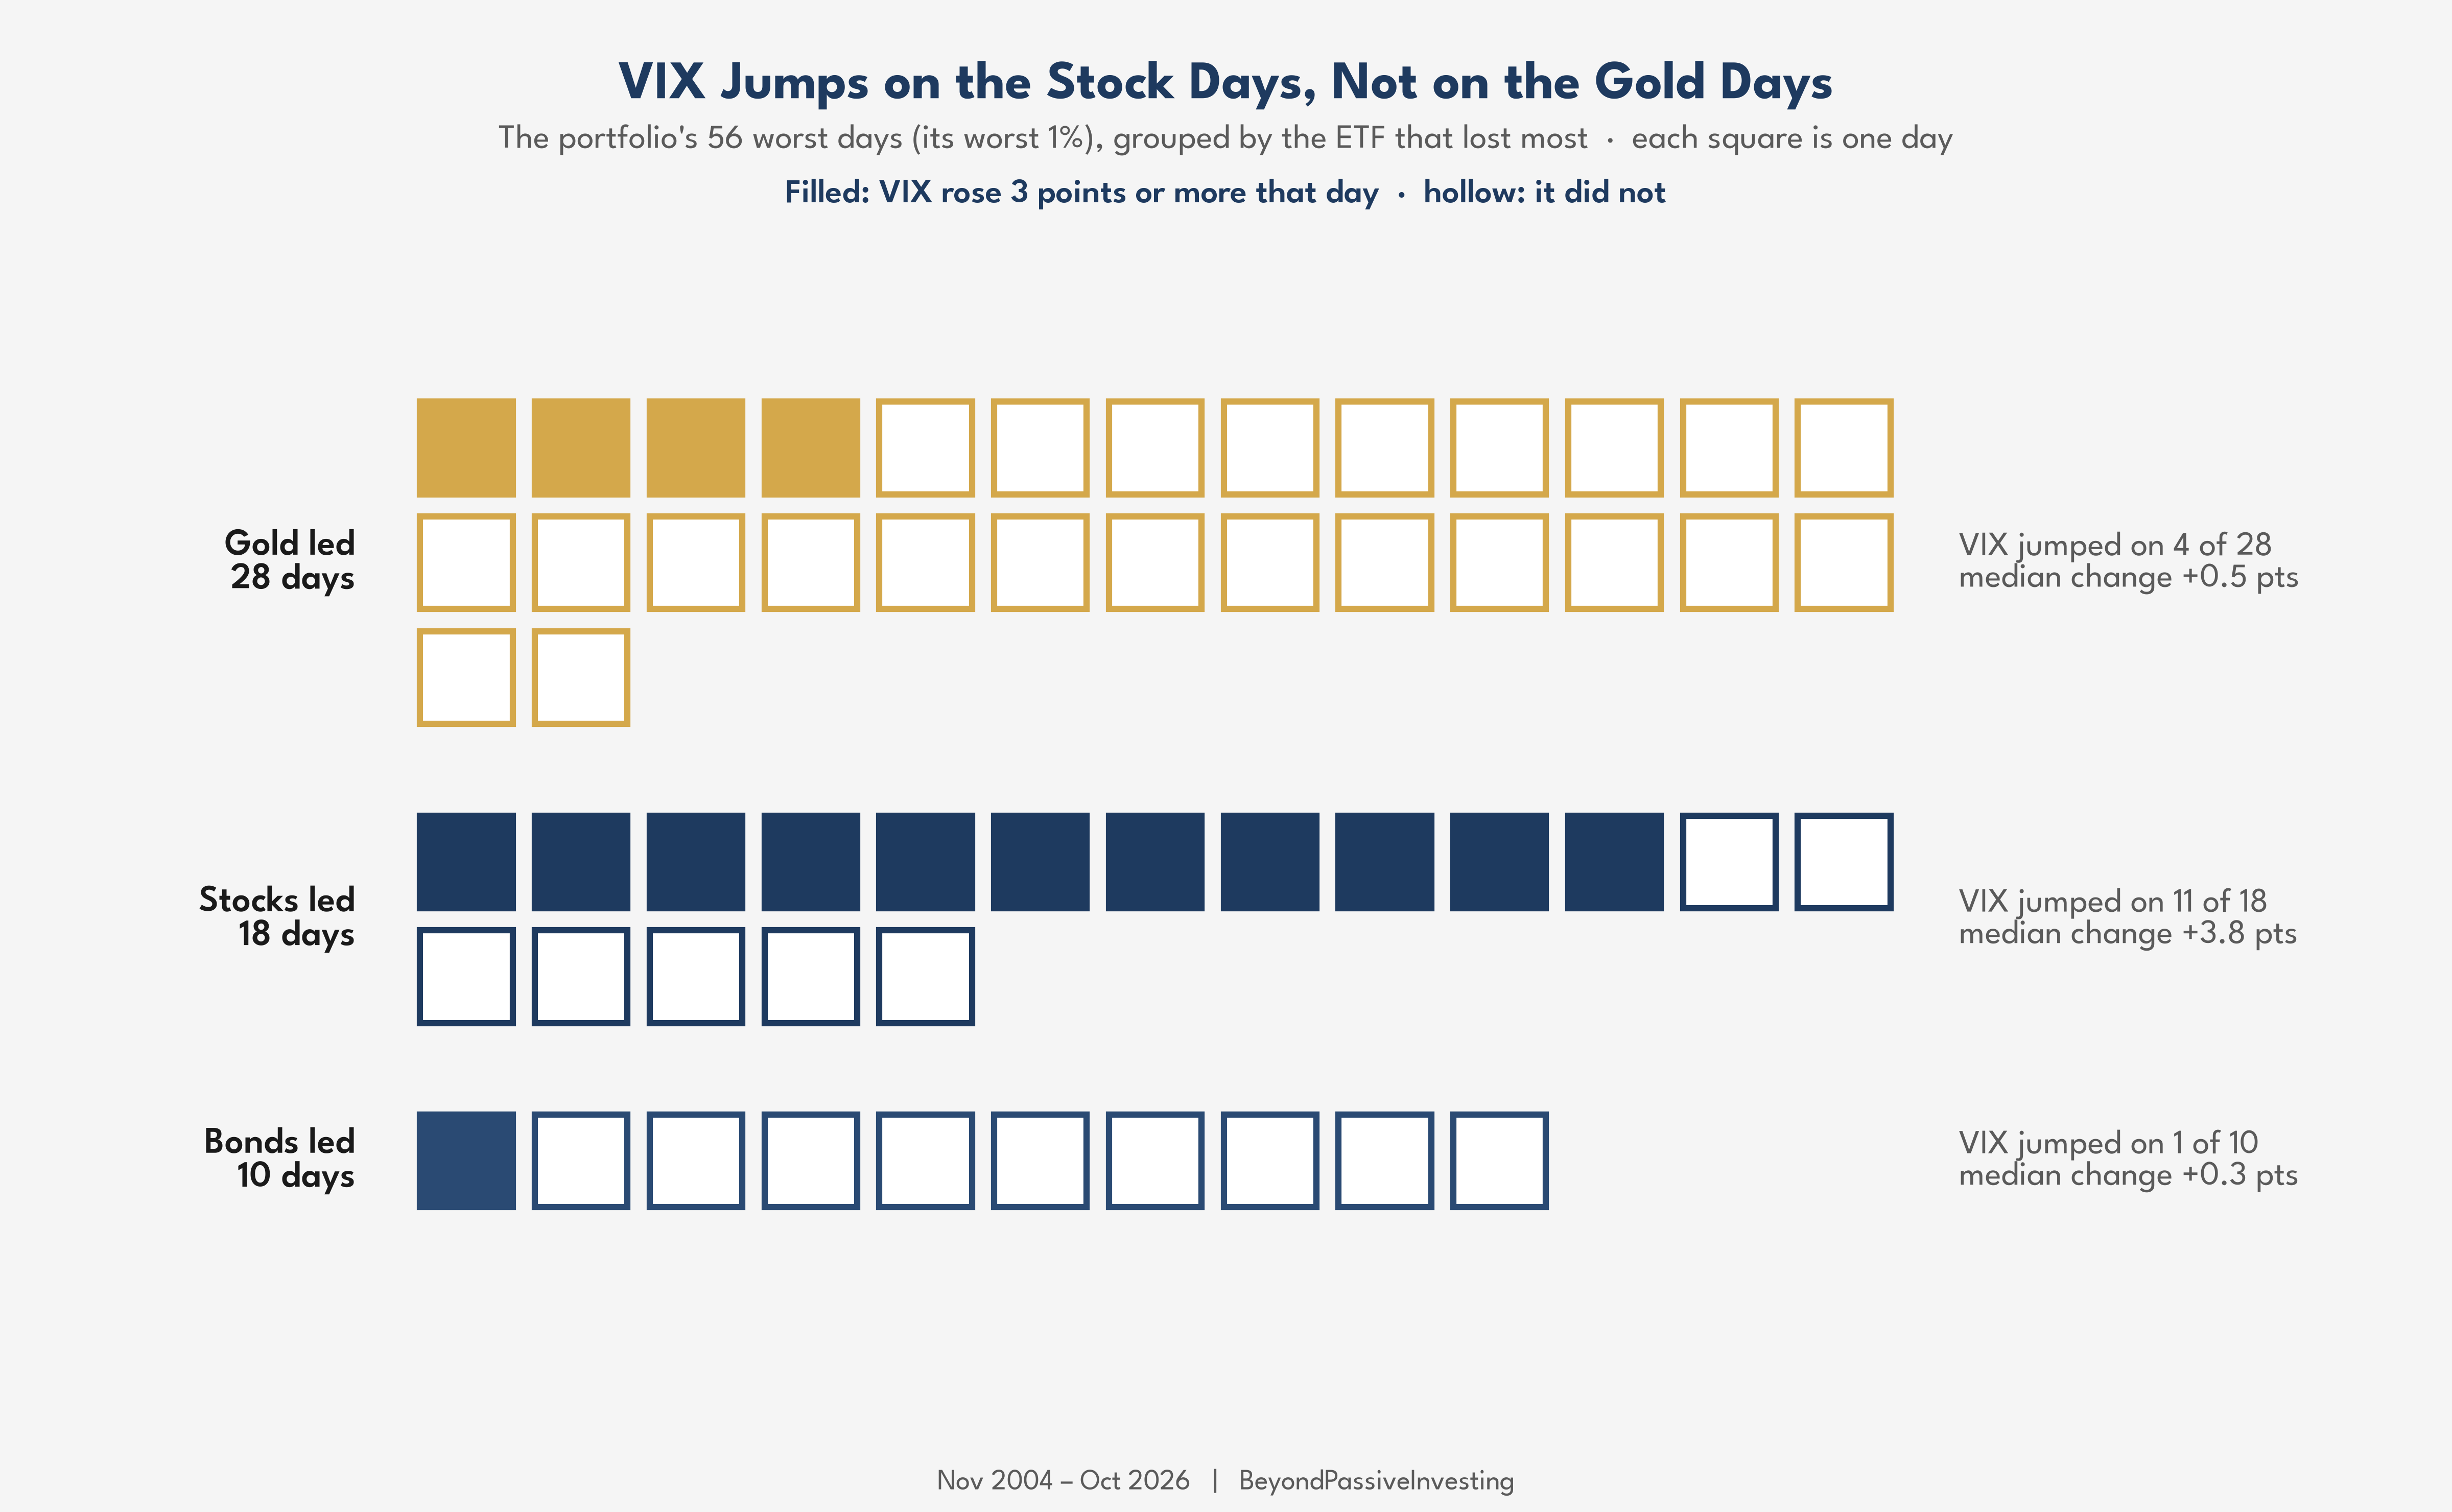
Stocks lead only 18 of the 56 days; gold leads 28 and long bonds 10. VIX rose by three points or more on 11 of the 18 stock days, but on only 4 of the 28 gold days and once on the bond days. On 21 October 2025 gold took 3.1% off the portfolio, and VIX fell.
Even a free VIX would not help
Few investors hold long VIX permanently, because carrying it is expensive: VIXY, the fund that holds the shortest VIX futures, lost 67% a year in log terms from 2011 to 2026. A large literature tries to time it instead, by the shape of the futures curve, by market features or by carry. But since 2004 VIX has at least doubled within a month only fourteen times, so every such rule rests on a dozen or so events, and the danger of curve fitting is high. The cleaner question is whether VIX would help if it cost nothing at all:
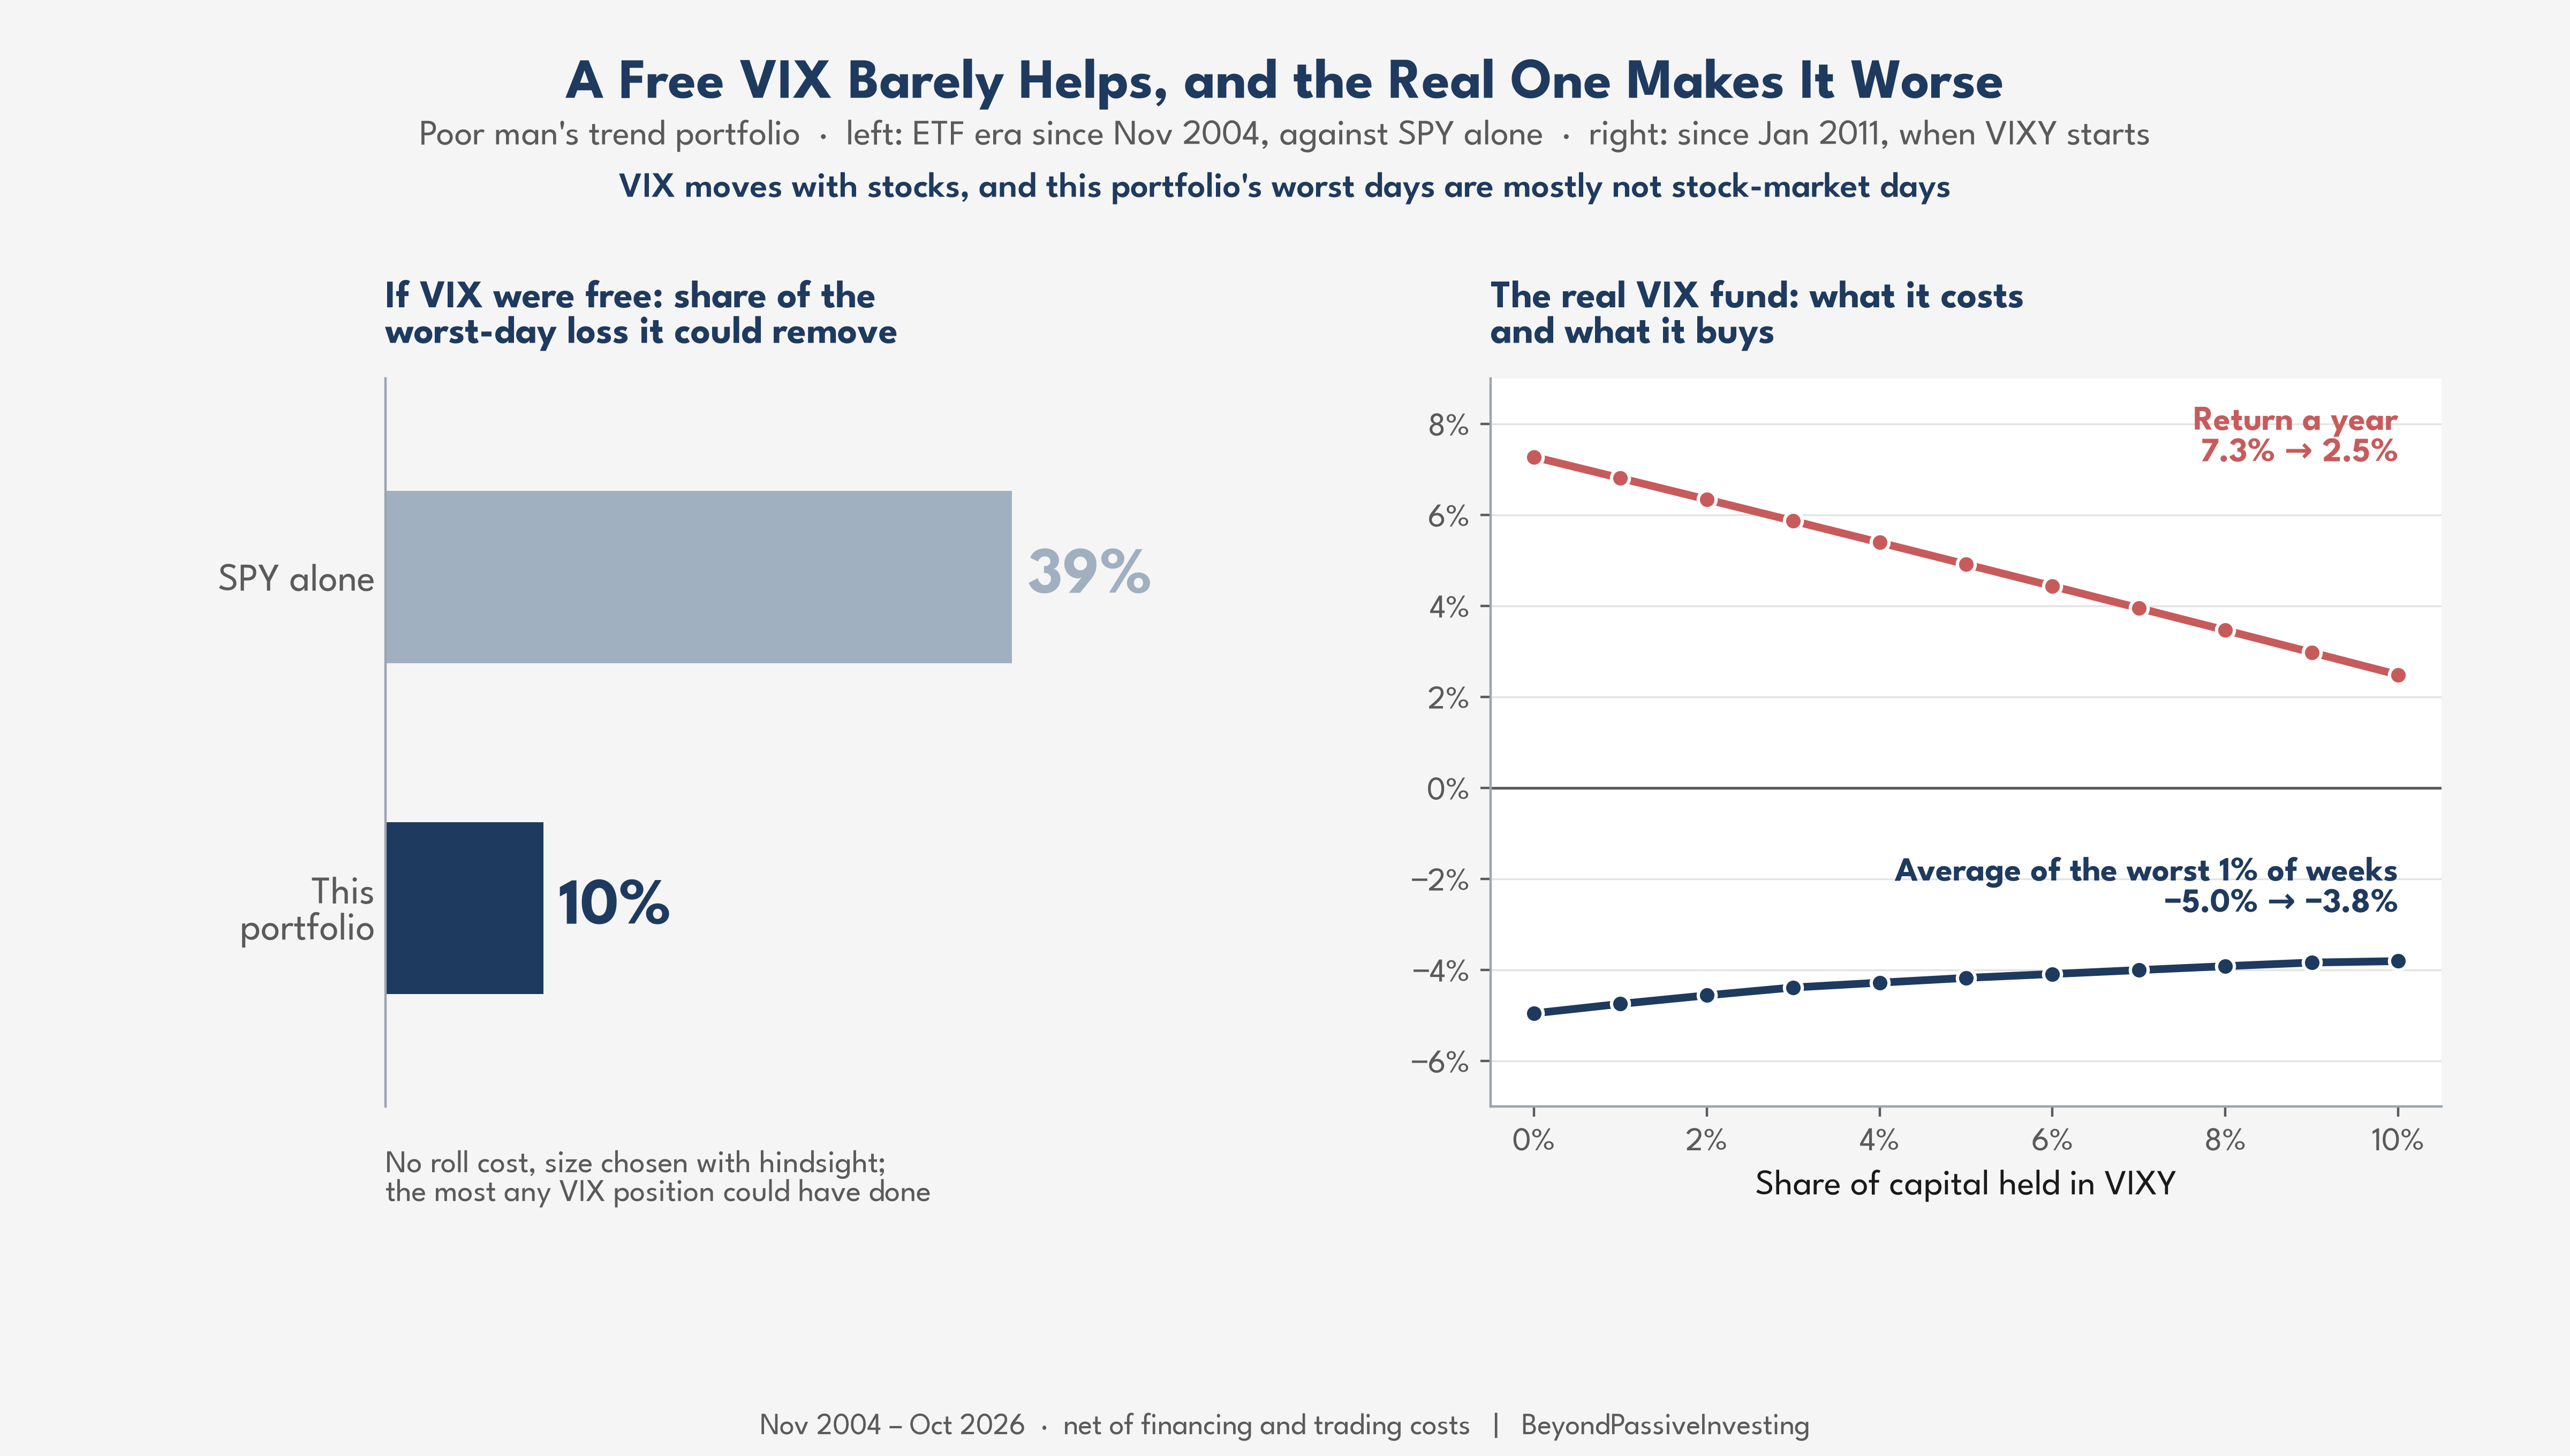
For SPY on its own, a free VIX removes up to 39% of the worst-day loss. For this portfolio it removes 10%, because no position in VIX, timed or not, makes money on the days gold falls. The real fund is worse: every percent of capital in VIXY cost about half a point of return a year and made the worst weeks only about a tenth of a point less bad. With 10% in VIXY the return falls from 7.3% to 2.5% a year, and the worst weeks soften only from −5.0% to −3.8%.
What helps instead: less leverage in calm markets
The worst days share one thing besides their asset: they arrive when the portfolio is levered. Rule three scales up after calm spells, and the portfolio held more than its capital on 35% of days since 2004:
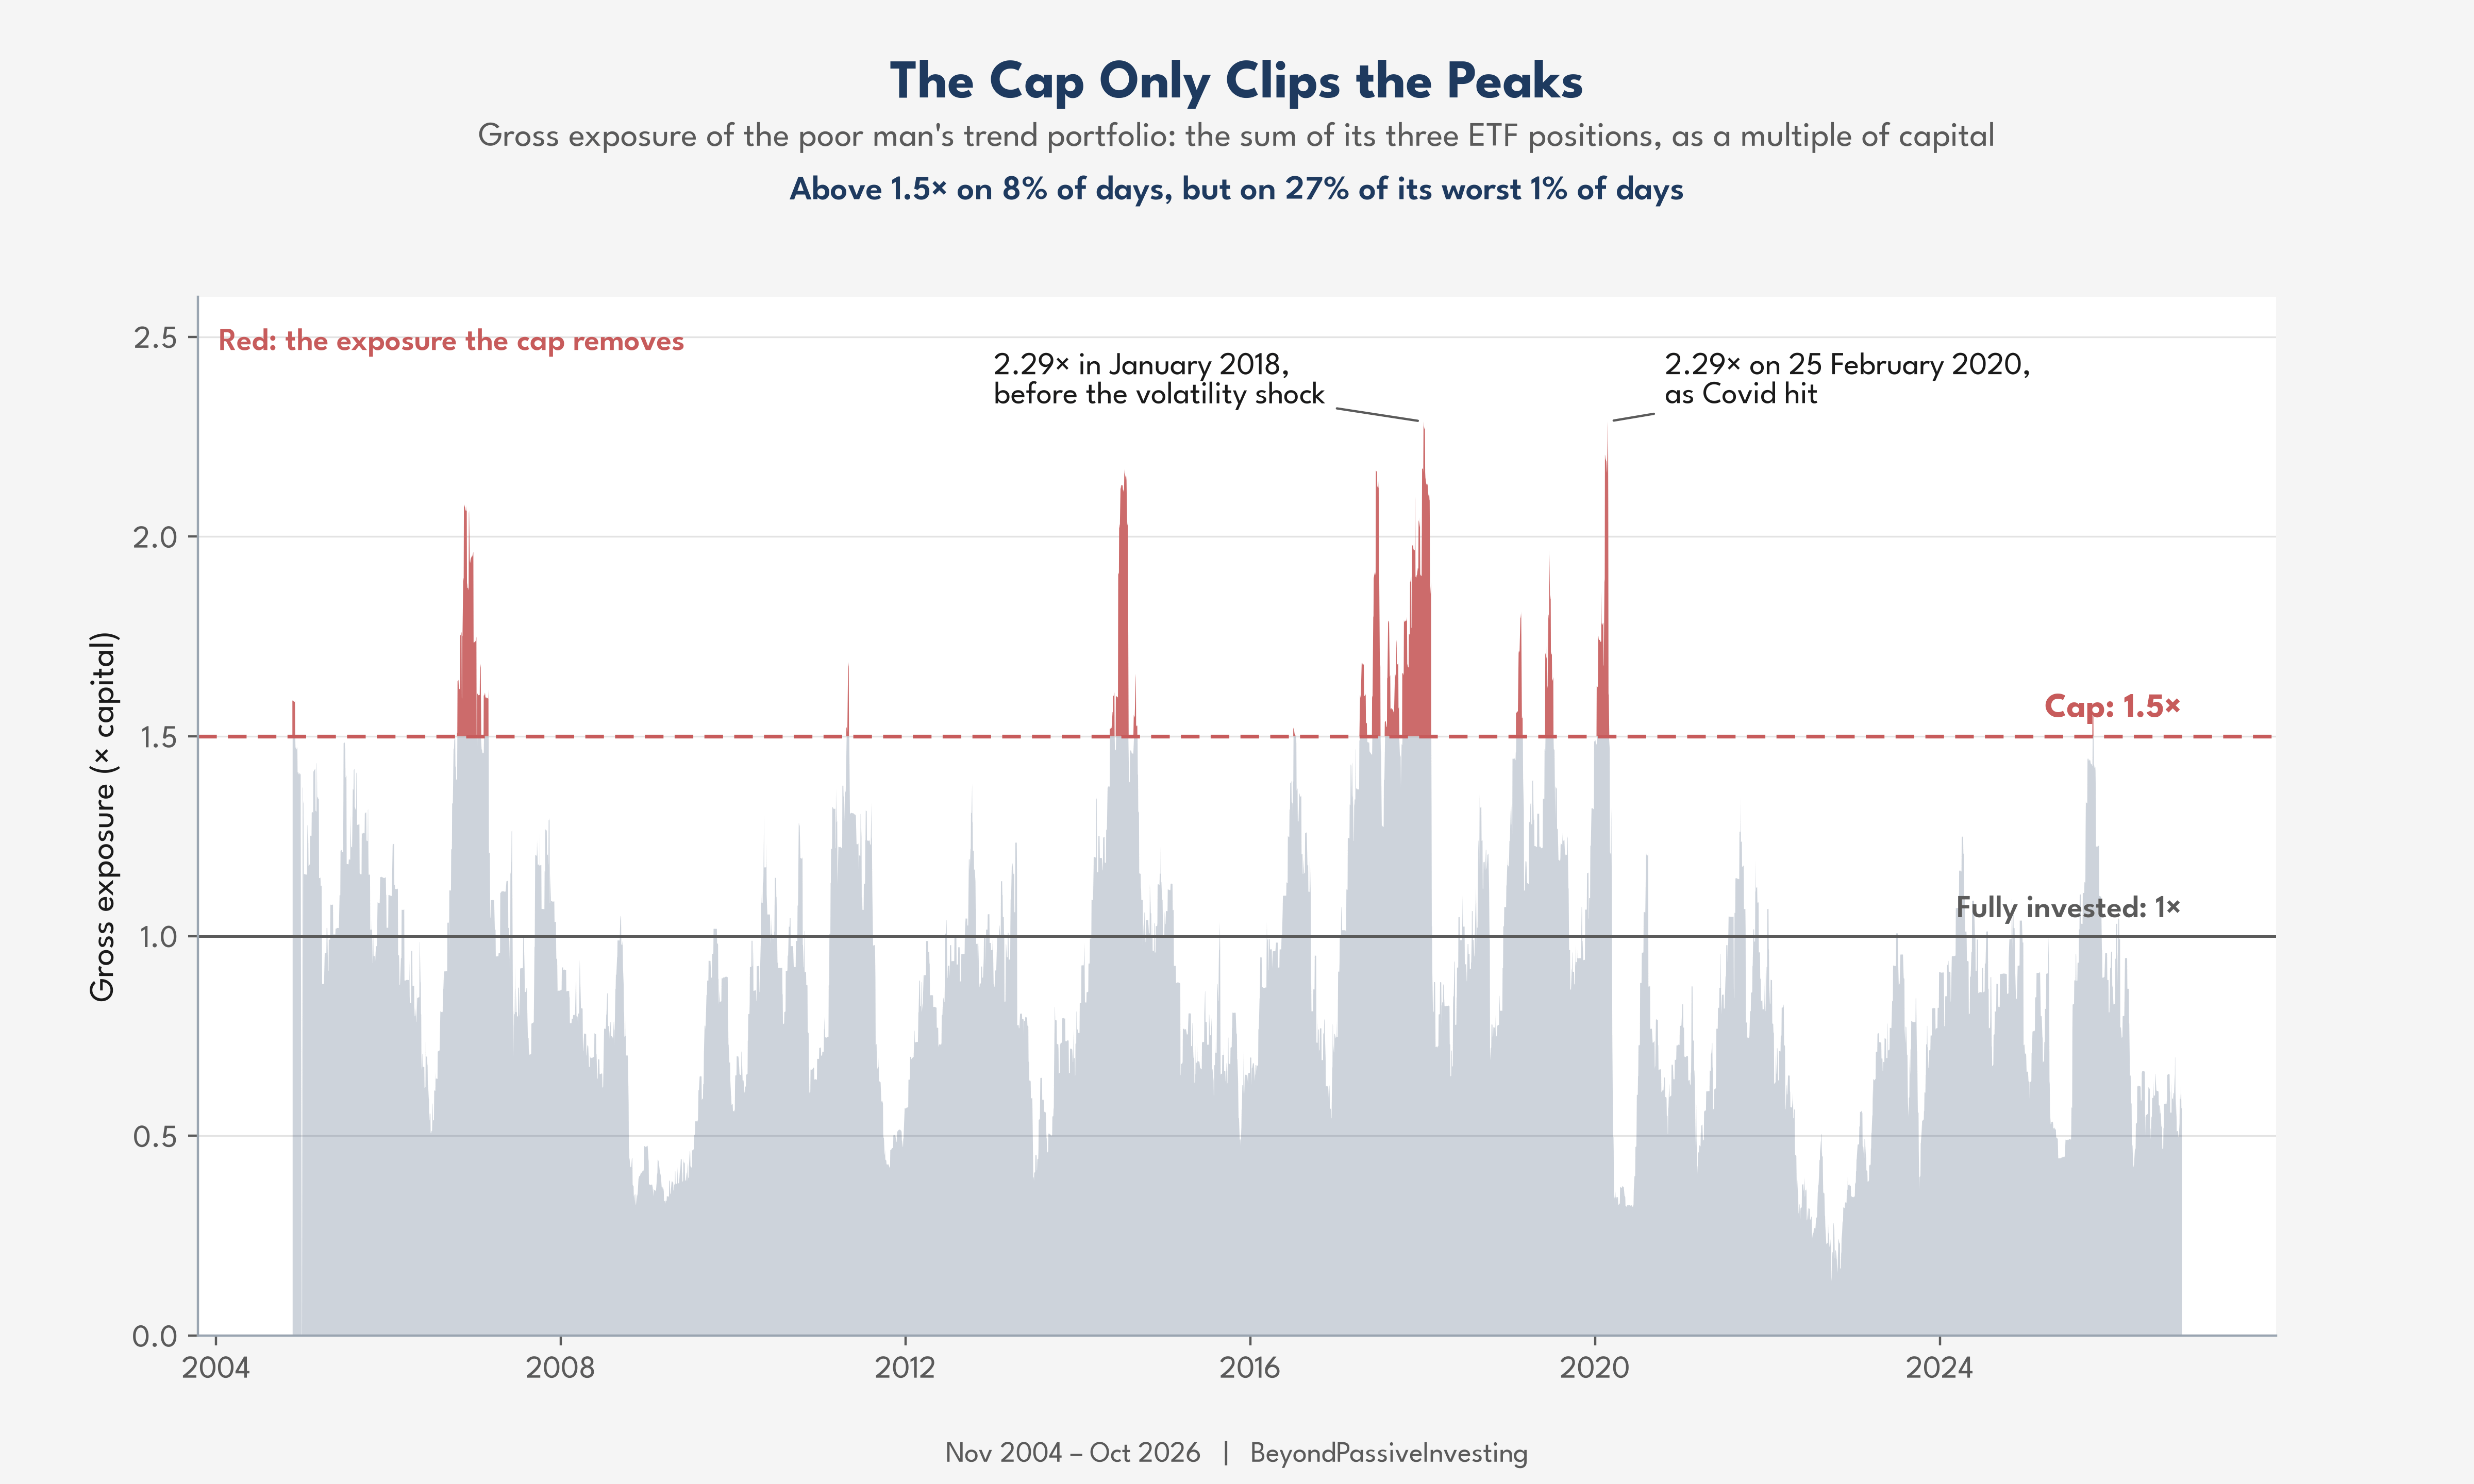
Exposure was above 1.5 times on 8% of days, but on 27% of the worst days. The week of 24 February 2020 began at 2.27 times and cost 7.3%, and a single day typically carries two thirds of a bad week’s loss, faster than any three-month volatility estimate can react. The remedy is a cap: at the 8% target, never more than 1.5 times capital in total and never more than 0.7 in one ETF. It leaves every rule in place and clips the target on about one day in nine.
A rule for execution, not for the strategy
The cap does not change what the strategy wants to hold, only how far the account follows it at the extremes. That makes it an execution parameter, like the no-trade band that decides when to trade: the portfolio is checked every day and rebalanced in full only when an ETF drifts more than a fifth from its target or the portfolio’s volatility more than half a point from 8%, about 70 times a year. Execution parameters should not need fine-tuning, and these do not:
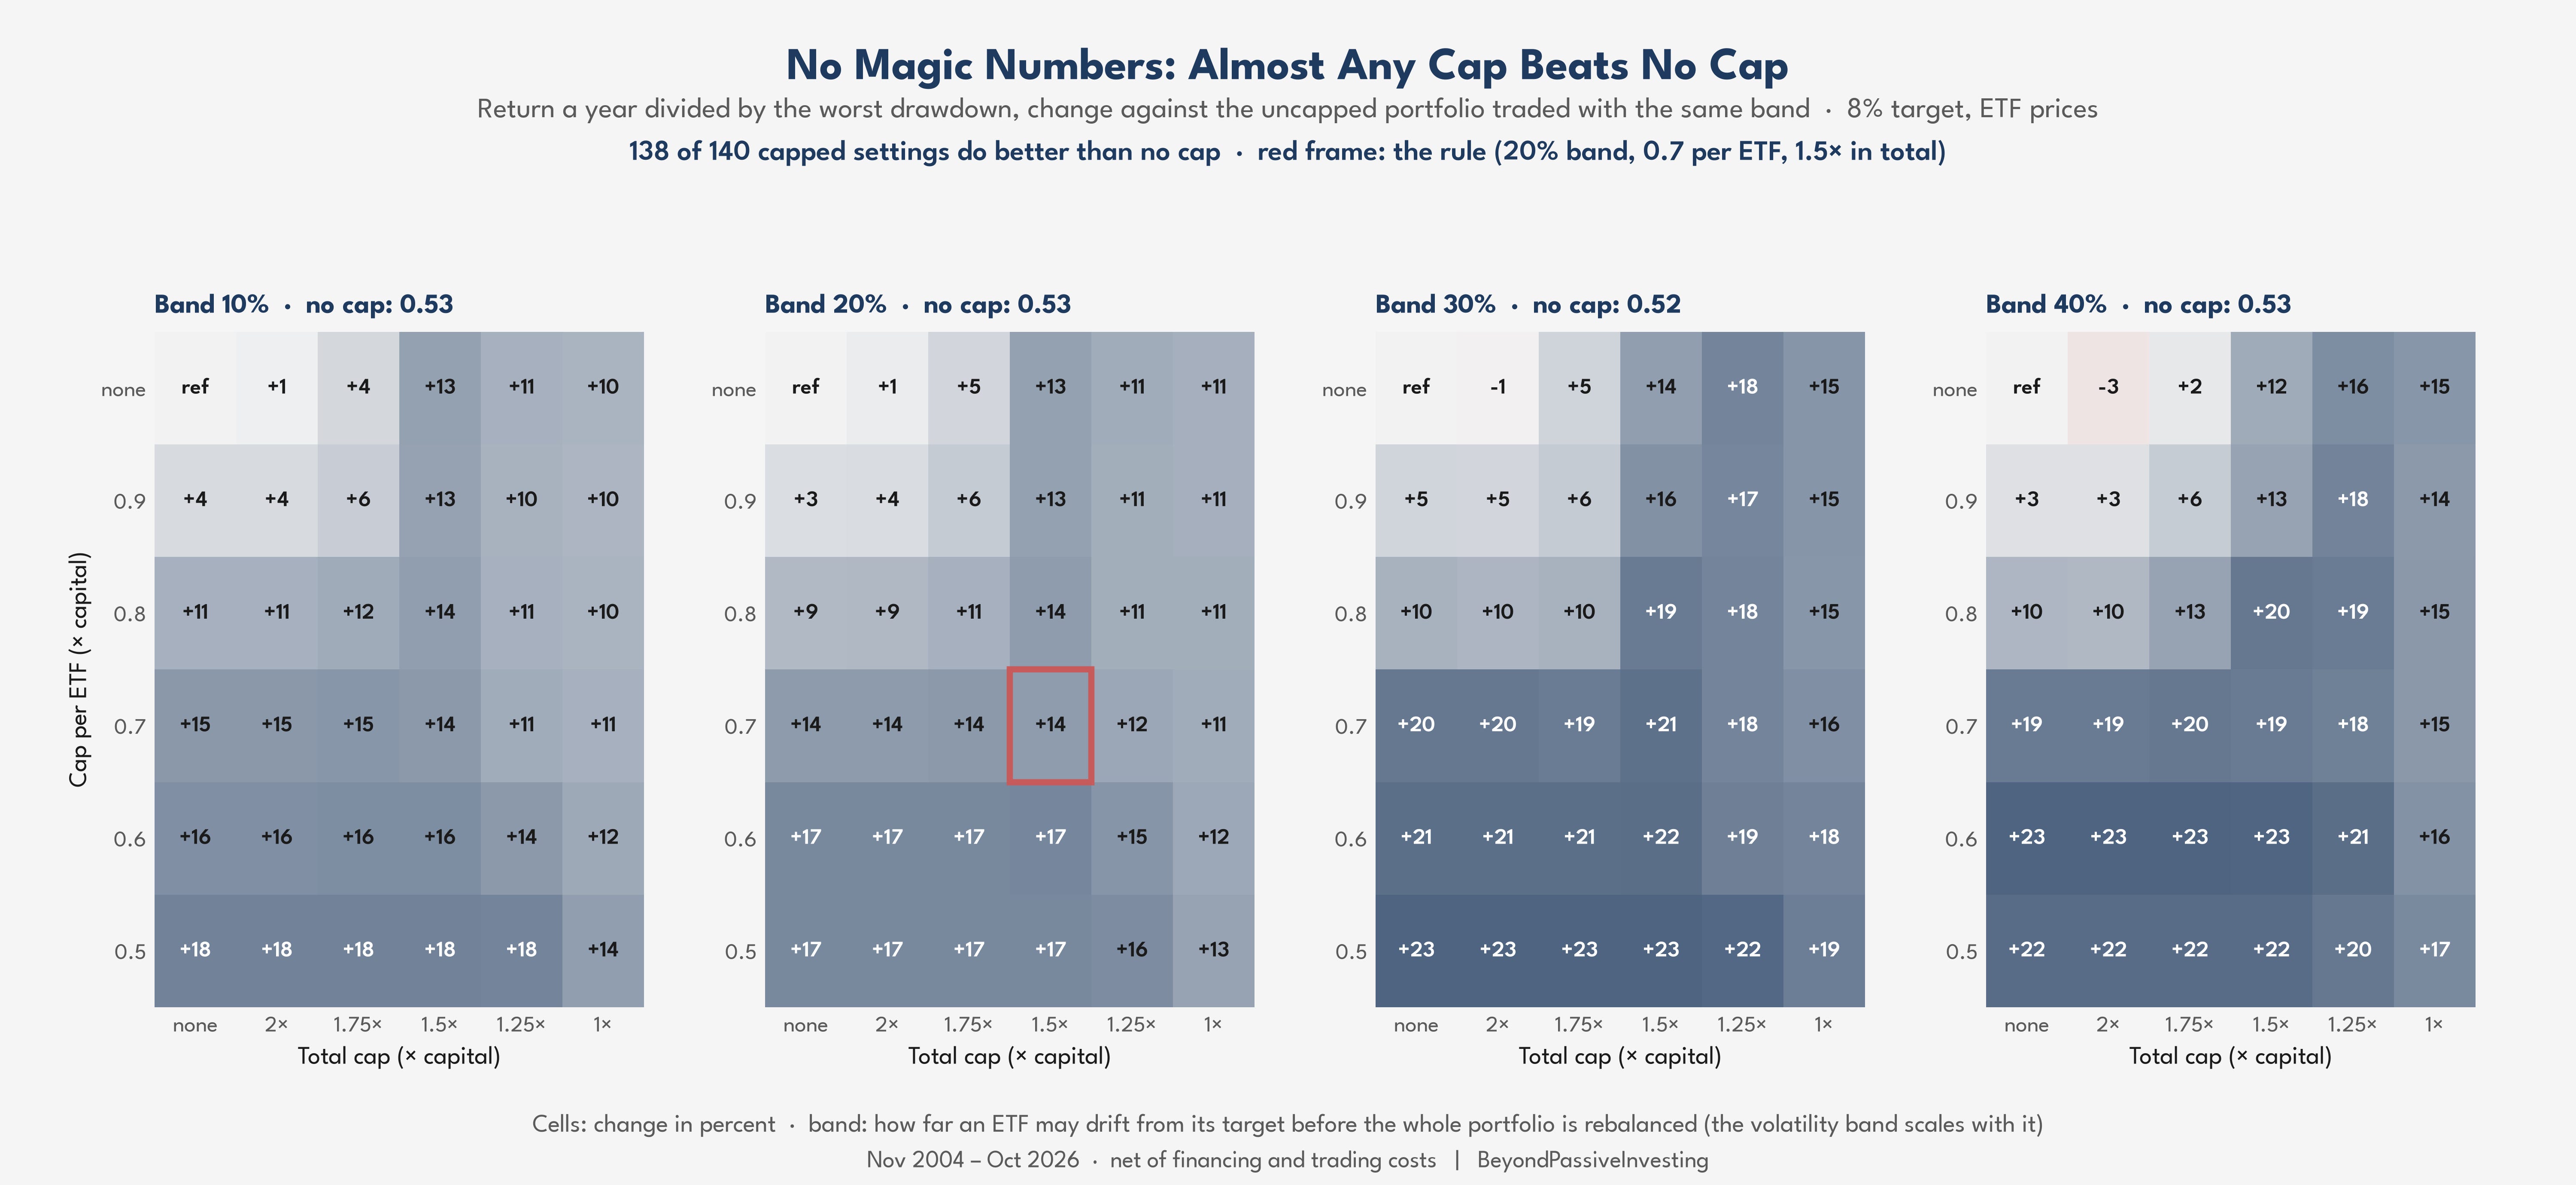
Of 140 combinations of band, per-ETF cap and total cap, 138 beat no cap on ETF prices and 136 over the long history, typically by a tenth to a fifth; the exception is a loose total cap of two times with no per-ETF limit. The ratio flatters tighter caps a little, because a smaller book earns interest on its cash, and on the Martin ratio, which counts every drawdown over cash, a third of the long-history settings fall just short of no cap. So the simplest version of the rule is enough: trade when the drift matters, and hold no more than about 1.5 times capital in total and 0.7 in one ETF for every 8% of target volatility. At 6% that is 1.12 times, at 10% 1.88 times, and scaled this way the cap does the same job at every level. Which target fits is a question of life phase rather than market view, as the articles on short horizons and on spending down savings under the four percent rule argue.
Back to the portfolio
Here is the portfolio from the start of this article again, now with the cap:
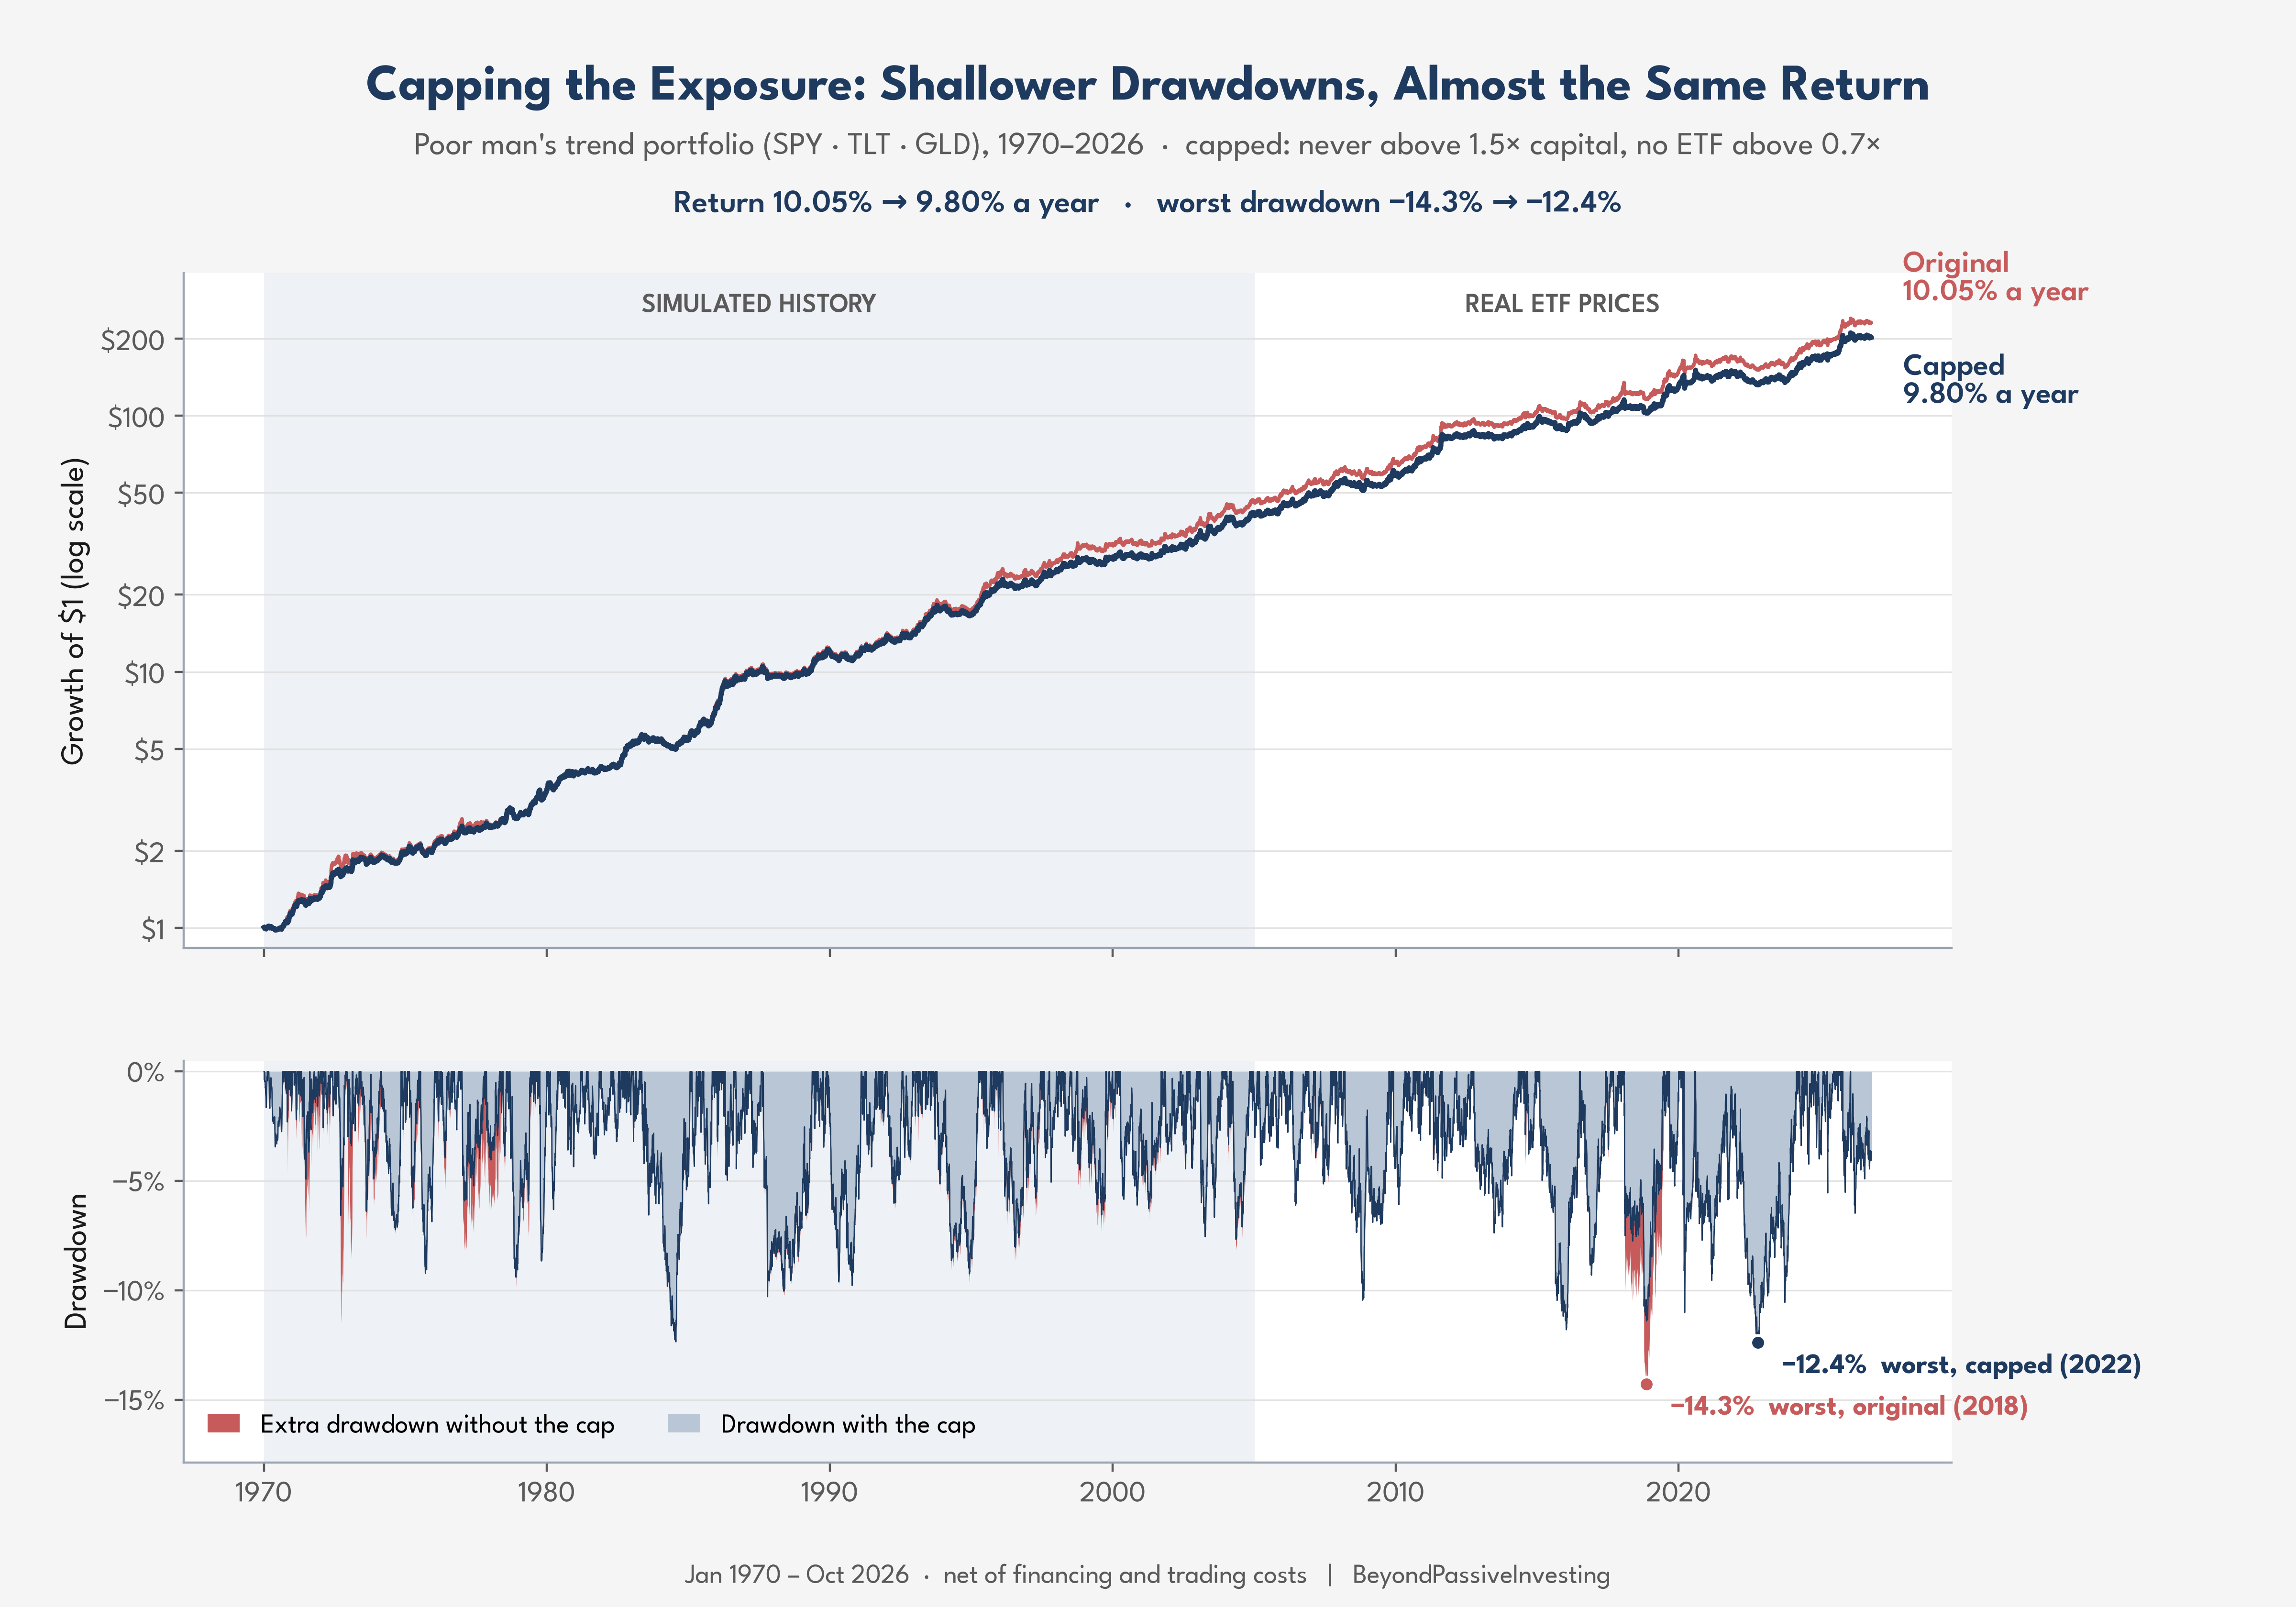
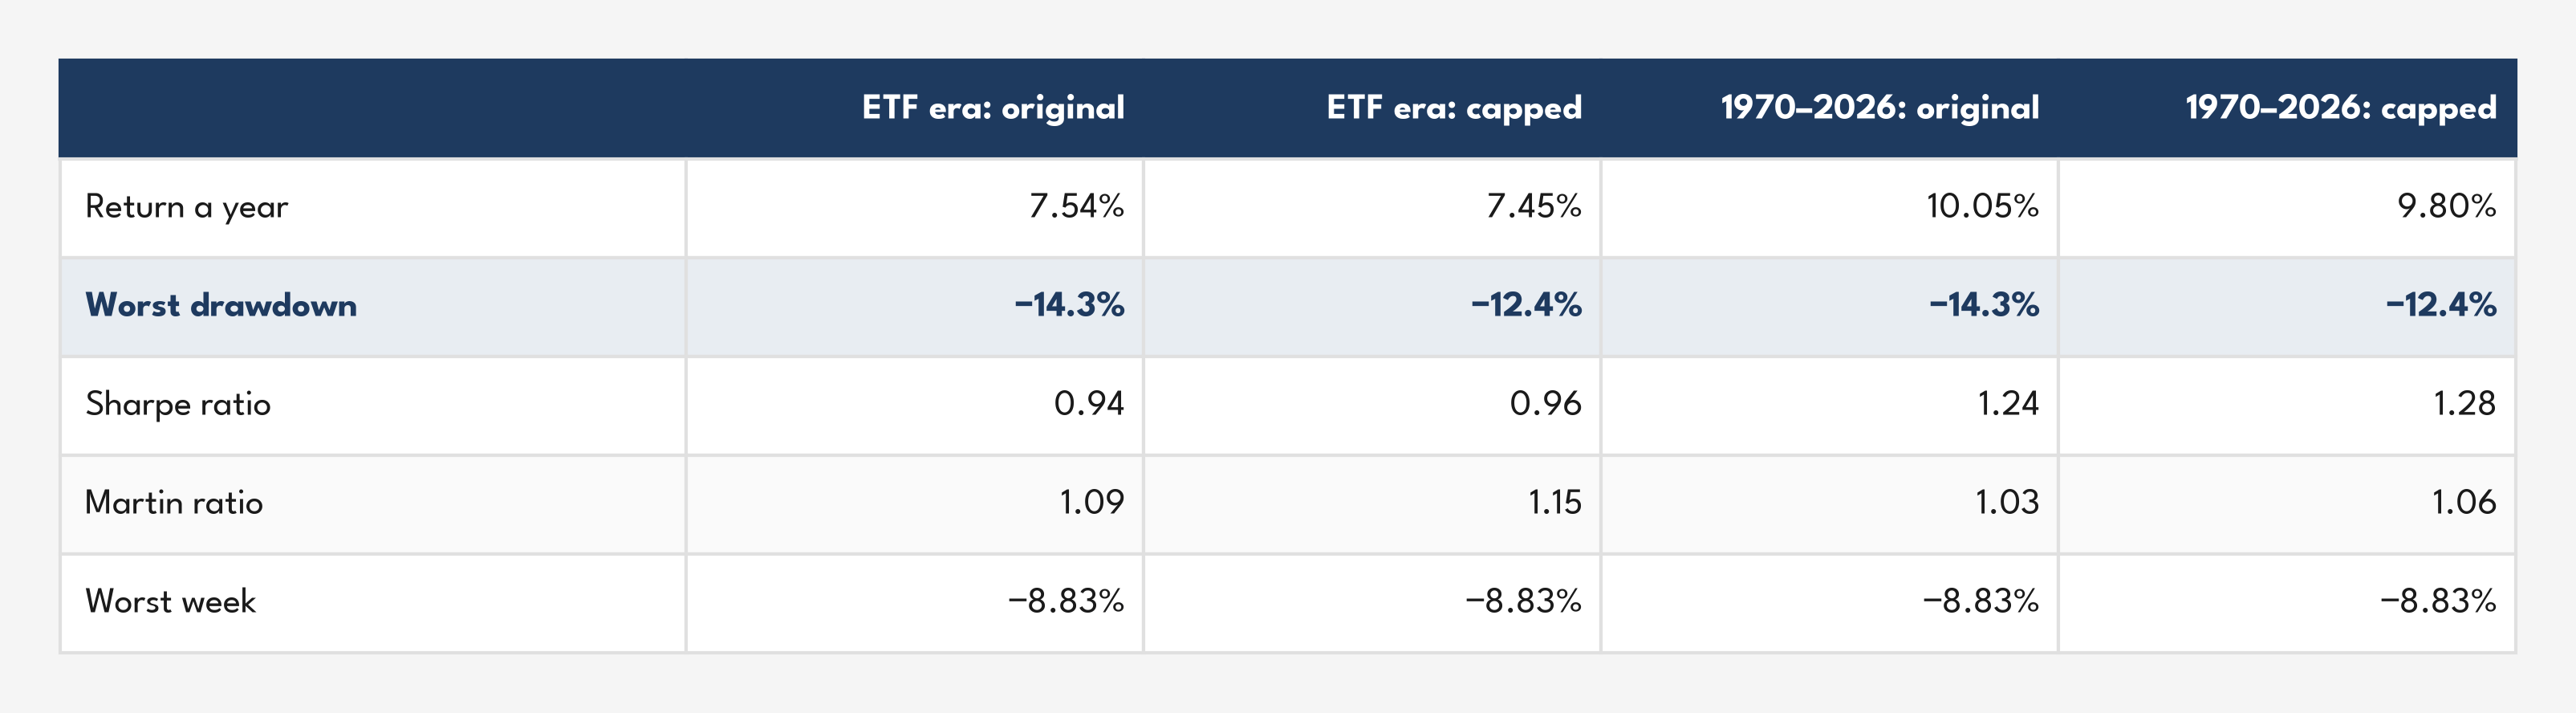
The return is almost unchanged, and the drawdowns shrink where the portfolio was most levered, above all in 2018. On ETF prices the return per unit of weekly tail loss rises by 11%, with a 90% bootstrap interval of 1% to 23%, and since 2011 buying the same weekly protection with VIXY would have cost 171 basis points a year instead of the cap’s 18. Over the long history the gain is half as large. The cap does nothing for the worst week, 9 to 13 March 2020, which began at 1.3 times capital, or for the slide from August 2020 to October 2022, when bonds and gold fell together at 0.68 times, and from 1990 to 2004 it did slightly worse than no cap.
Cap the exposure, skip the VIX
For a risk-parity portfolio, long volatility on the stock market is the wrong hedge. VIX insures the third of the tail that comes from stocks, would remove little of it even for free, and costs more than it saves at every size. The damage comes from leverage taken on in calm markets, and the fix is an execution rule rather than a new strategy: a limit on exposure in proportion to the risk target, which takes the worst drawdown on ETF prices from 14.3% to 12.4% for about a tenth of a point of return a year.
Going beyond passive does not mean buying every hedge on offer. It means knowing which risk the portfolio actually holds.
Data: daily prices of SPY, TLT, GLD and VIXY and the VIX index from Yahoo Finance (snapshot of 23 October 2026), and the effective Fed funds rate from FRED. Before 2005 the history uses a synthetic long bond rebuilt from FRED Treasury yields and the London PM gold fix. Every trade is placed at the close on signals from the close before.
Gold leading 28 of the 56 worst days and long bonds another 10, with stocks leading only 18, changes what a hedge for this portfolio should look like. Capping exposure at 1.5 times capital instead of buying VIX is an elegant fix, since the losses come from leverage being highest after calm periods.
Worth adding for anyone copying it: 2.27 times in SPY, TLT and GLD isn’t available in a normal margin account. Reg T caps an overnight ETF book at 2x, so you’d need portfolio margin or futures to run the uncapped version. Your 1.5x cap also happens to keep it inside what a plain account allows.