

There is 150 years of data on stocks, on bonds, on gold, and on property. On the asset most people actually hold, there is almost nothing. Cash has no volatility, so there seems to be nothing to measure. That turns out to be the wrong conclusion.
What is actually guaranteed
A Treasury bill promises a number. You put in a hundred, and in three months you get back a hundred plus a little, and the little is known in advance. Nothing about that promise has ever been broken in the sixteen countries in this dataset.
What is not promised is what the hundred buys. The real return on cash is the bill rate minus inflation, and neither of those two numbers belongs to the saver. One is set by a central bank, the other by everything else. The guarantee is on the path, not on the destination.
This distinction is invisible on a bank statement, which is the whole problem. A portfolio that falls forty percent produces a phone call. A balance that grows every single year while losing forty percent of its purchasing power produces nothing at all.
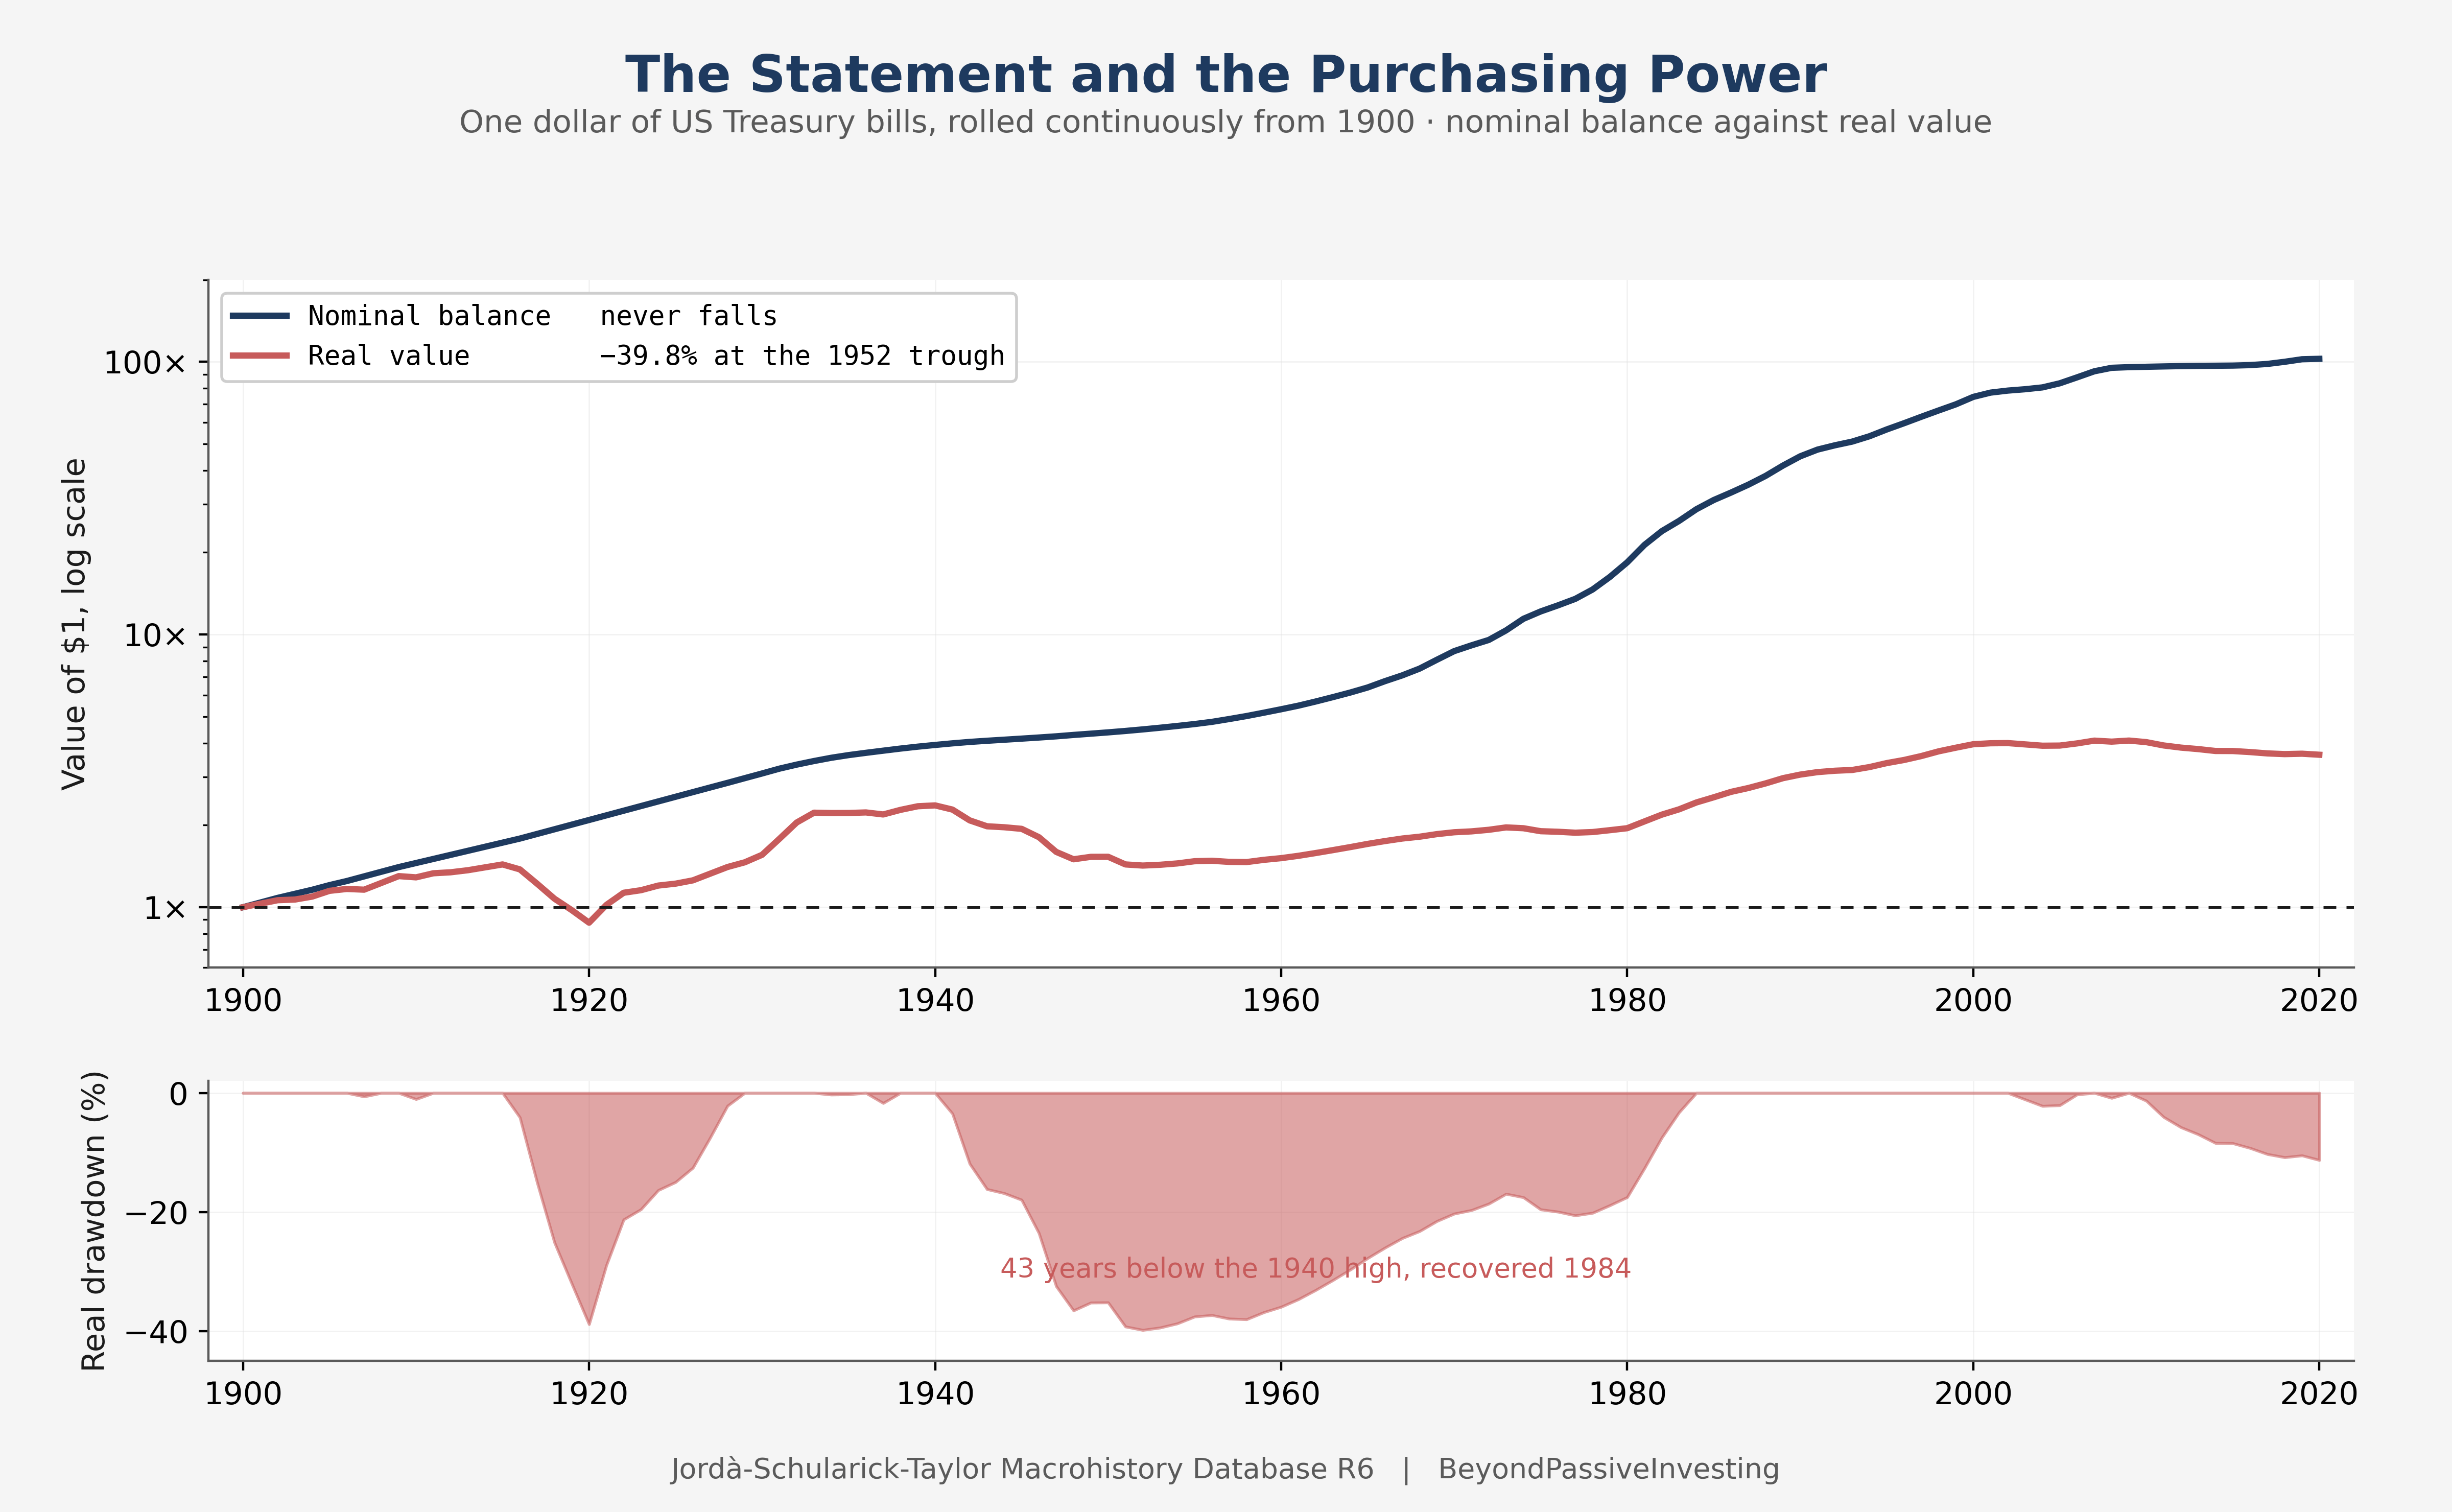
That is one US dollar in rolling Treasury bills since 1900. The nominal line never falls in 120 years. The real line drops by forty percent into 1952 and does not regain its 1940 level until 1984. Forty-three years underwater, and not one bank statement in that period showed a loss.
Why we believe otherwise
The belief that cash quietly earns a small positive real return is not superstition. It is induction from the periods most of us lived through.
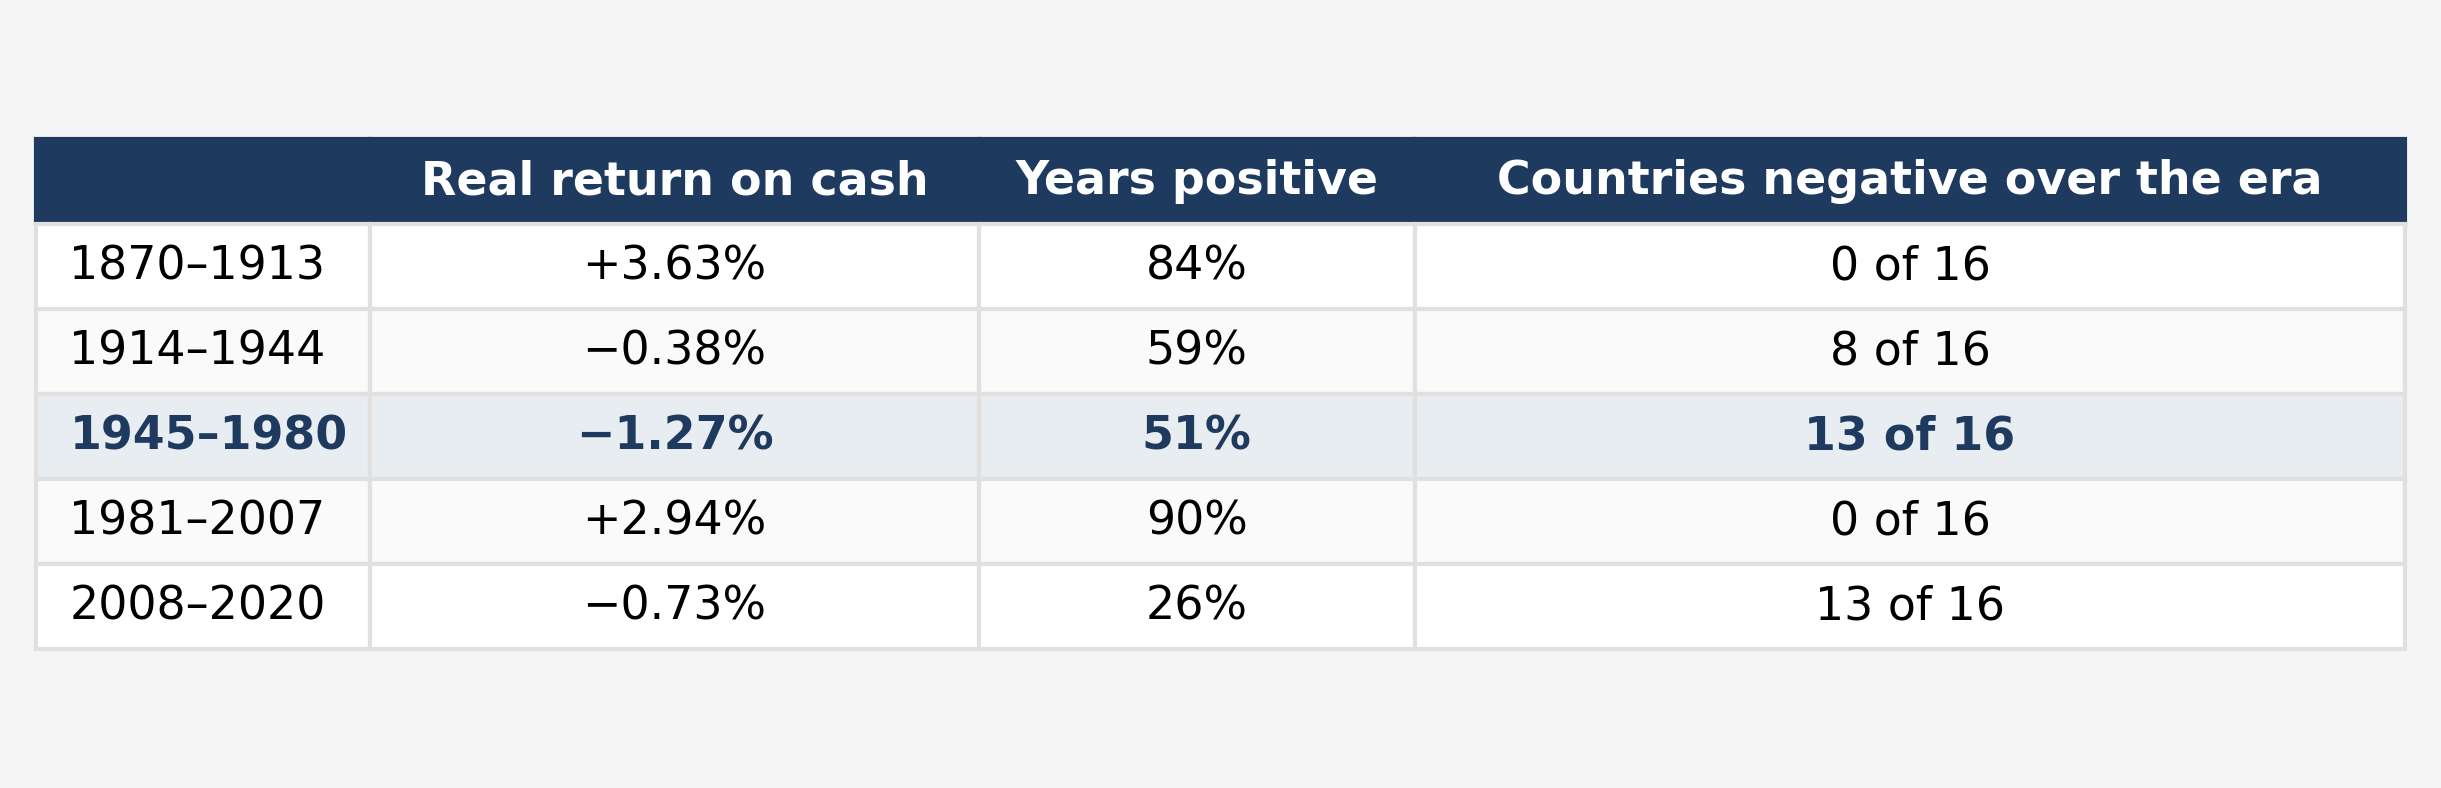
Under the classical gold standard, cash paid 3.6 percent a year after inflation across the sixteen countries, and it was positive in five years out of six. From 1981 to 2007 it paid 2.9 percent and was positive in nine years out of ten. Those are two of the best runs any asset had, and they came with no volatility attached. If you formed your intuition about savings accounts in either window, the intuition was correct for that window.
Almost everyone currently giving advice about cash formed it in the second one. That is not a criticism, it is a sampling problem. The 1945 to 1980 window was thirty-five years long and lost money in thirteen of the sixteen countries, and it is simply outside the experience of anyone who started working after about 1975.
A saving lifetime
Thirty-five bad years matters more for cash than for anything else, because thirty-five years is most of a working life. The relevant question is not what cash paid in a given year but what it paid over the span in which a person actually saves.
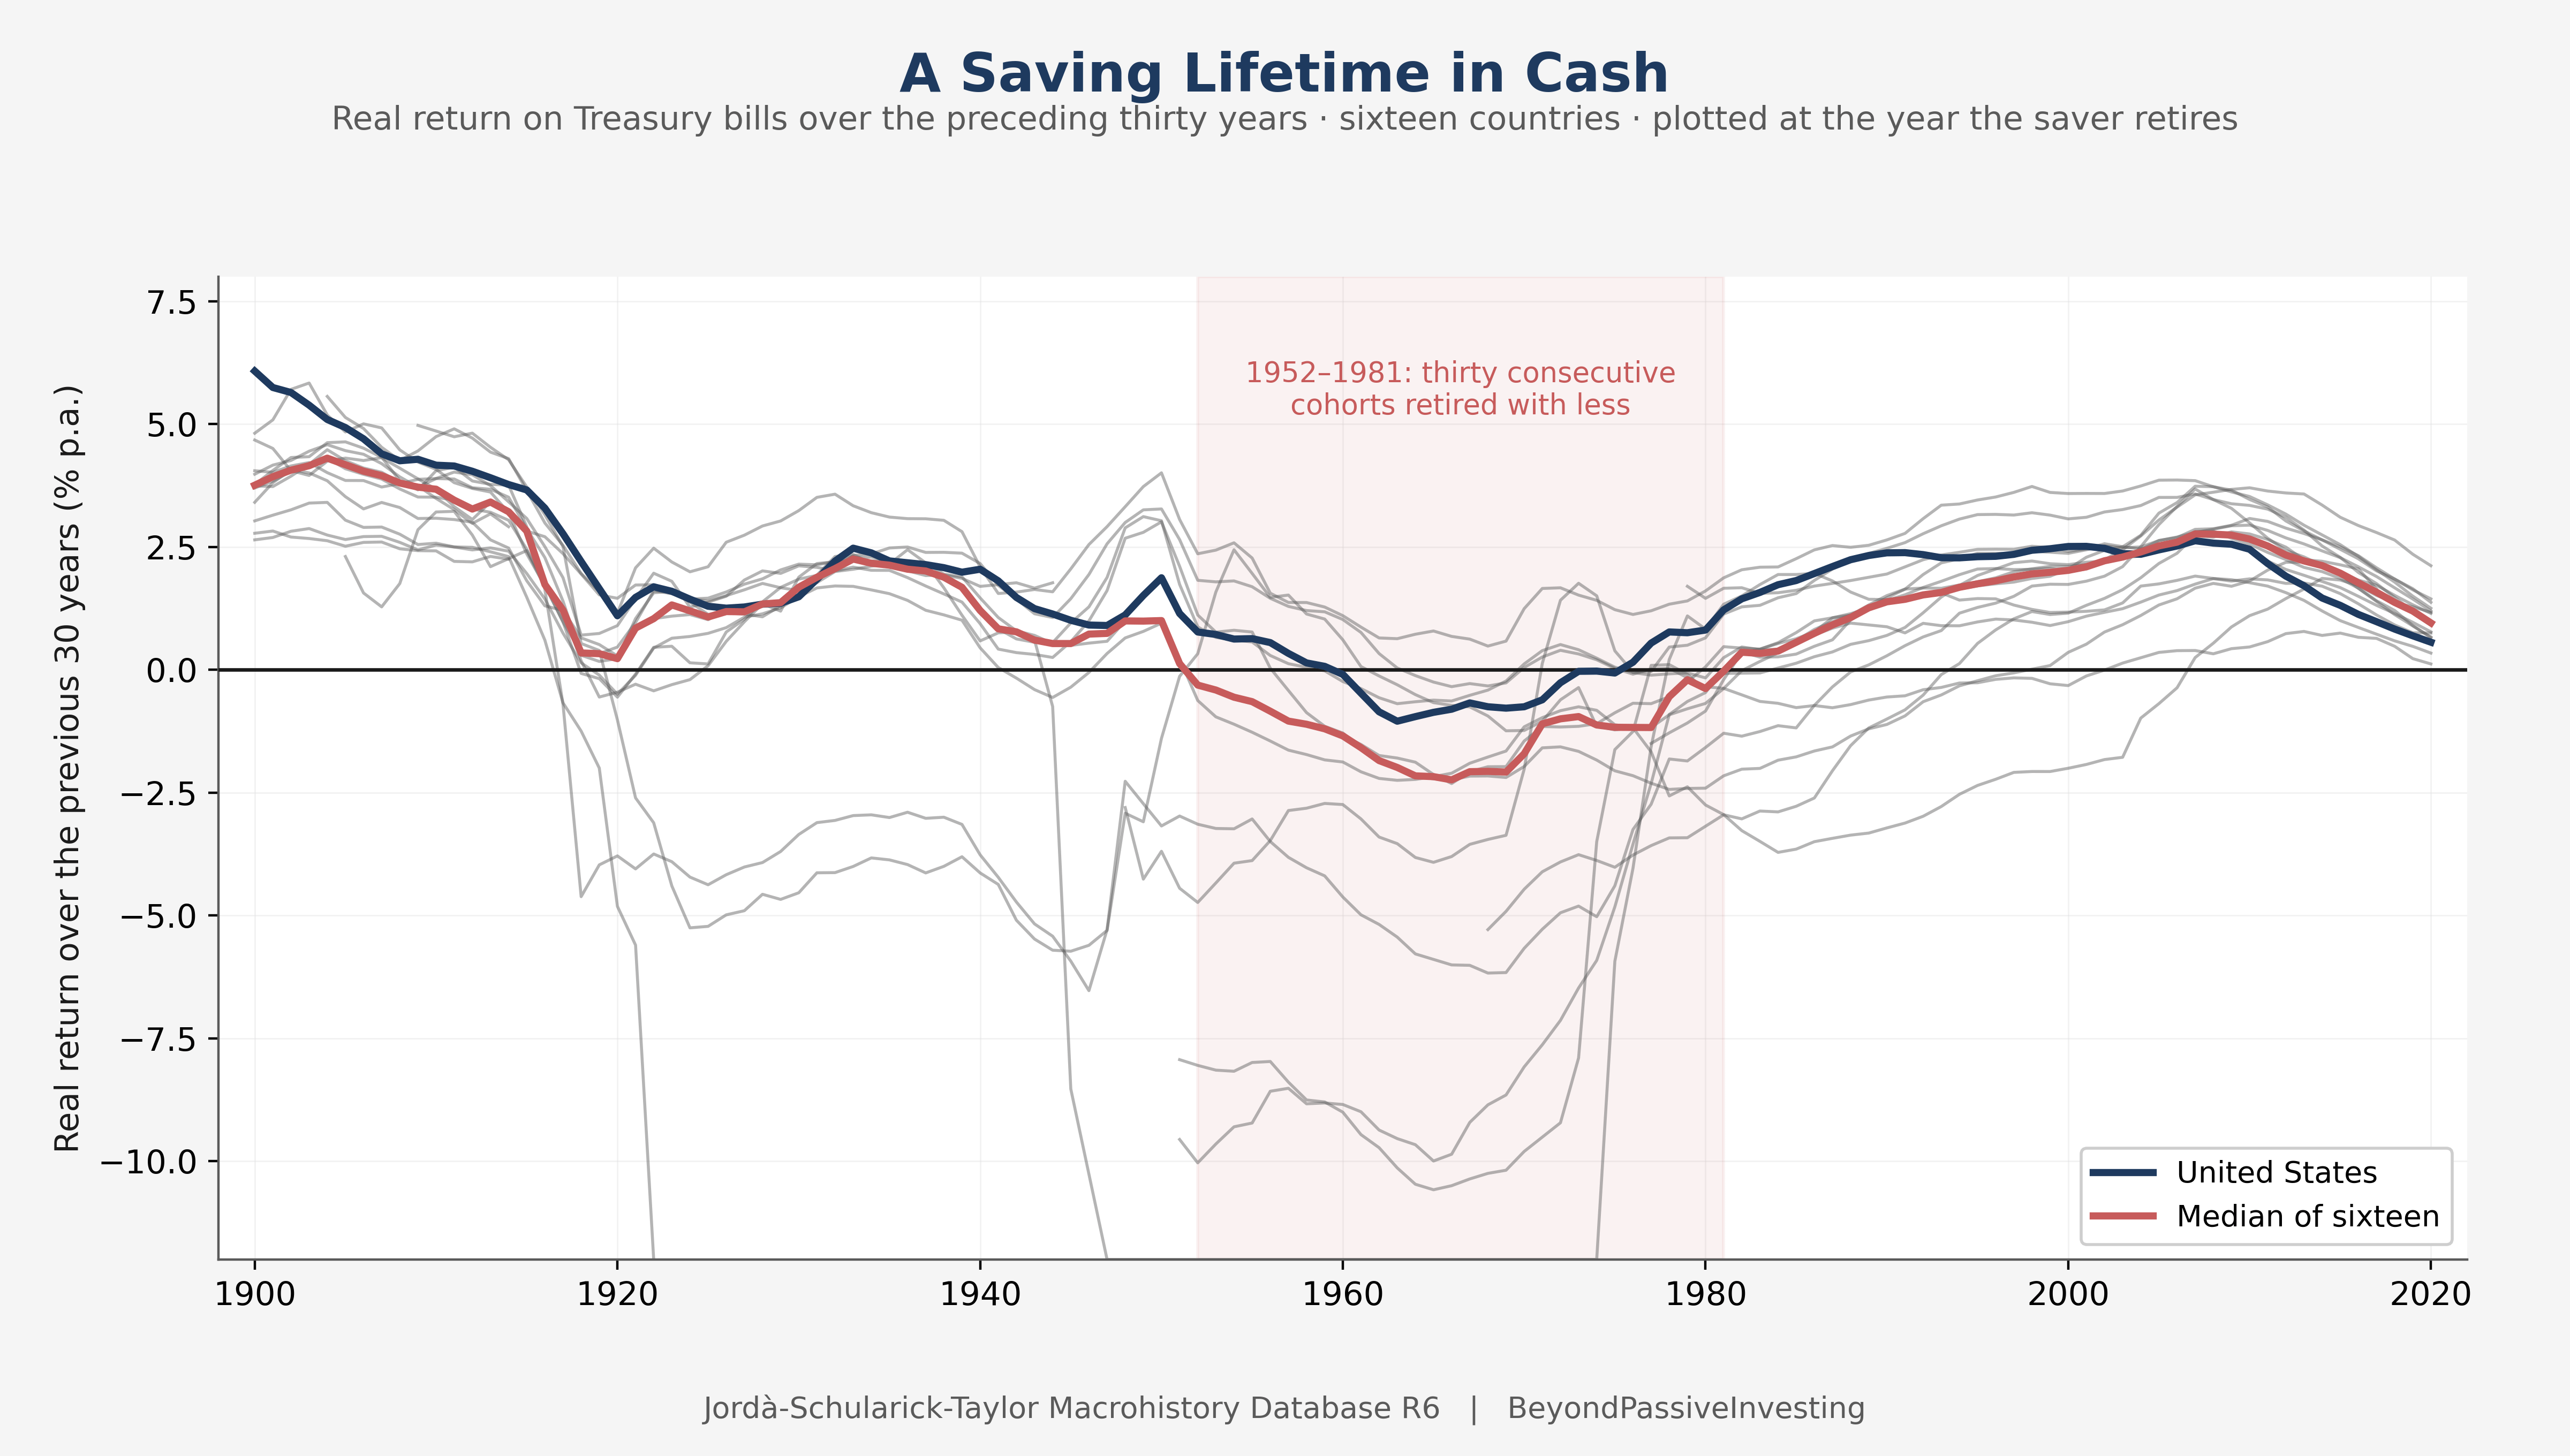
Each line is one country’s real return on bills over the previous thirty years, plotted at the year the saver stops. A point below zero means someone who saved in cash for three decades retired with less purchasing power than they put in.
The median country was below zero for thirty consecutive retirement years, from 1952 to 1981. Not a bad year, not a bad decade. Thirty cohorts in a row, each of whom did the responsible thing and ended up behind. Britain’s saver retiring in 1960 was down 1.9 percent a year over thirty years. Japan’s was worse by an order of magnitude, for reasons that are visible on any map of the 1940s.
Why waiting does not fix it
The usual answer to a bad asset is patience. Hold long enough and the good years cancel the bad ones. Readers of this publication will already object, and correctly: wealth compounds, so what a saver earns is the product of the annual returns and not their average, and those are two different numbers.

That gap is real and it is large for shares. Across the sixteen countries equities returned 6.87 percent a year averaged over every outcome, while a single uninterrupted trajectory compounds at 4.43. Nobody receives the first number. It describes a set of parallel worlds, and a saver lives in one. Cash barely suffers from this, because the gap grows with volatility and cash has almost none.
So by that argument cash should be the well-behaved asset. It is not, and the reason has nothing to do with compounding.
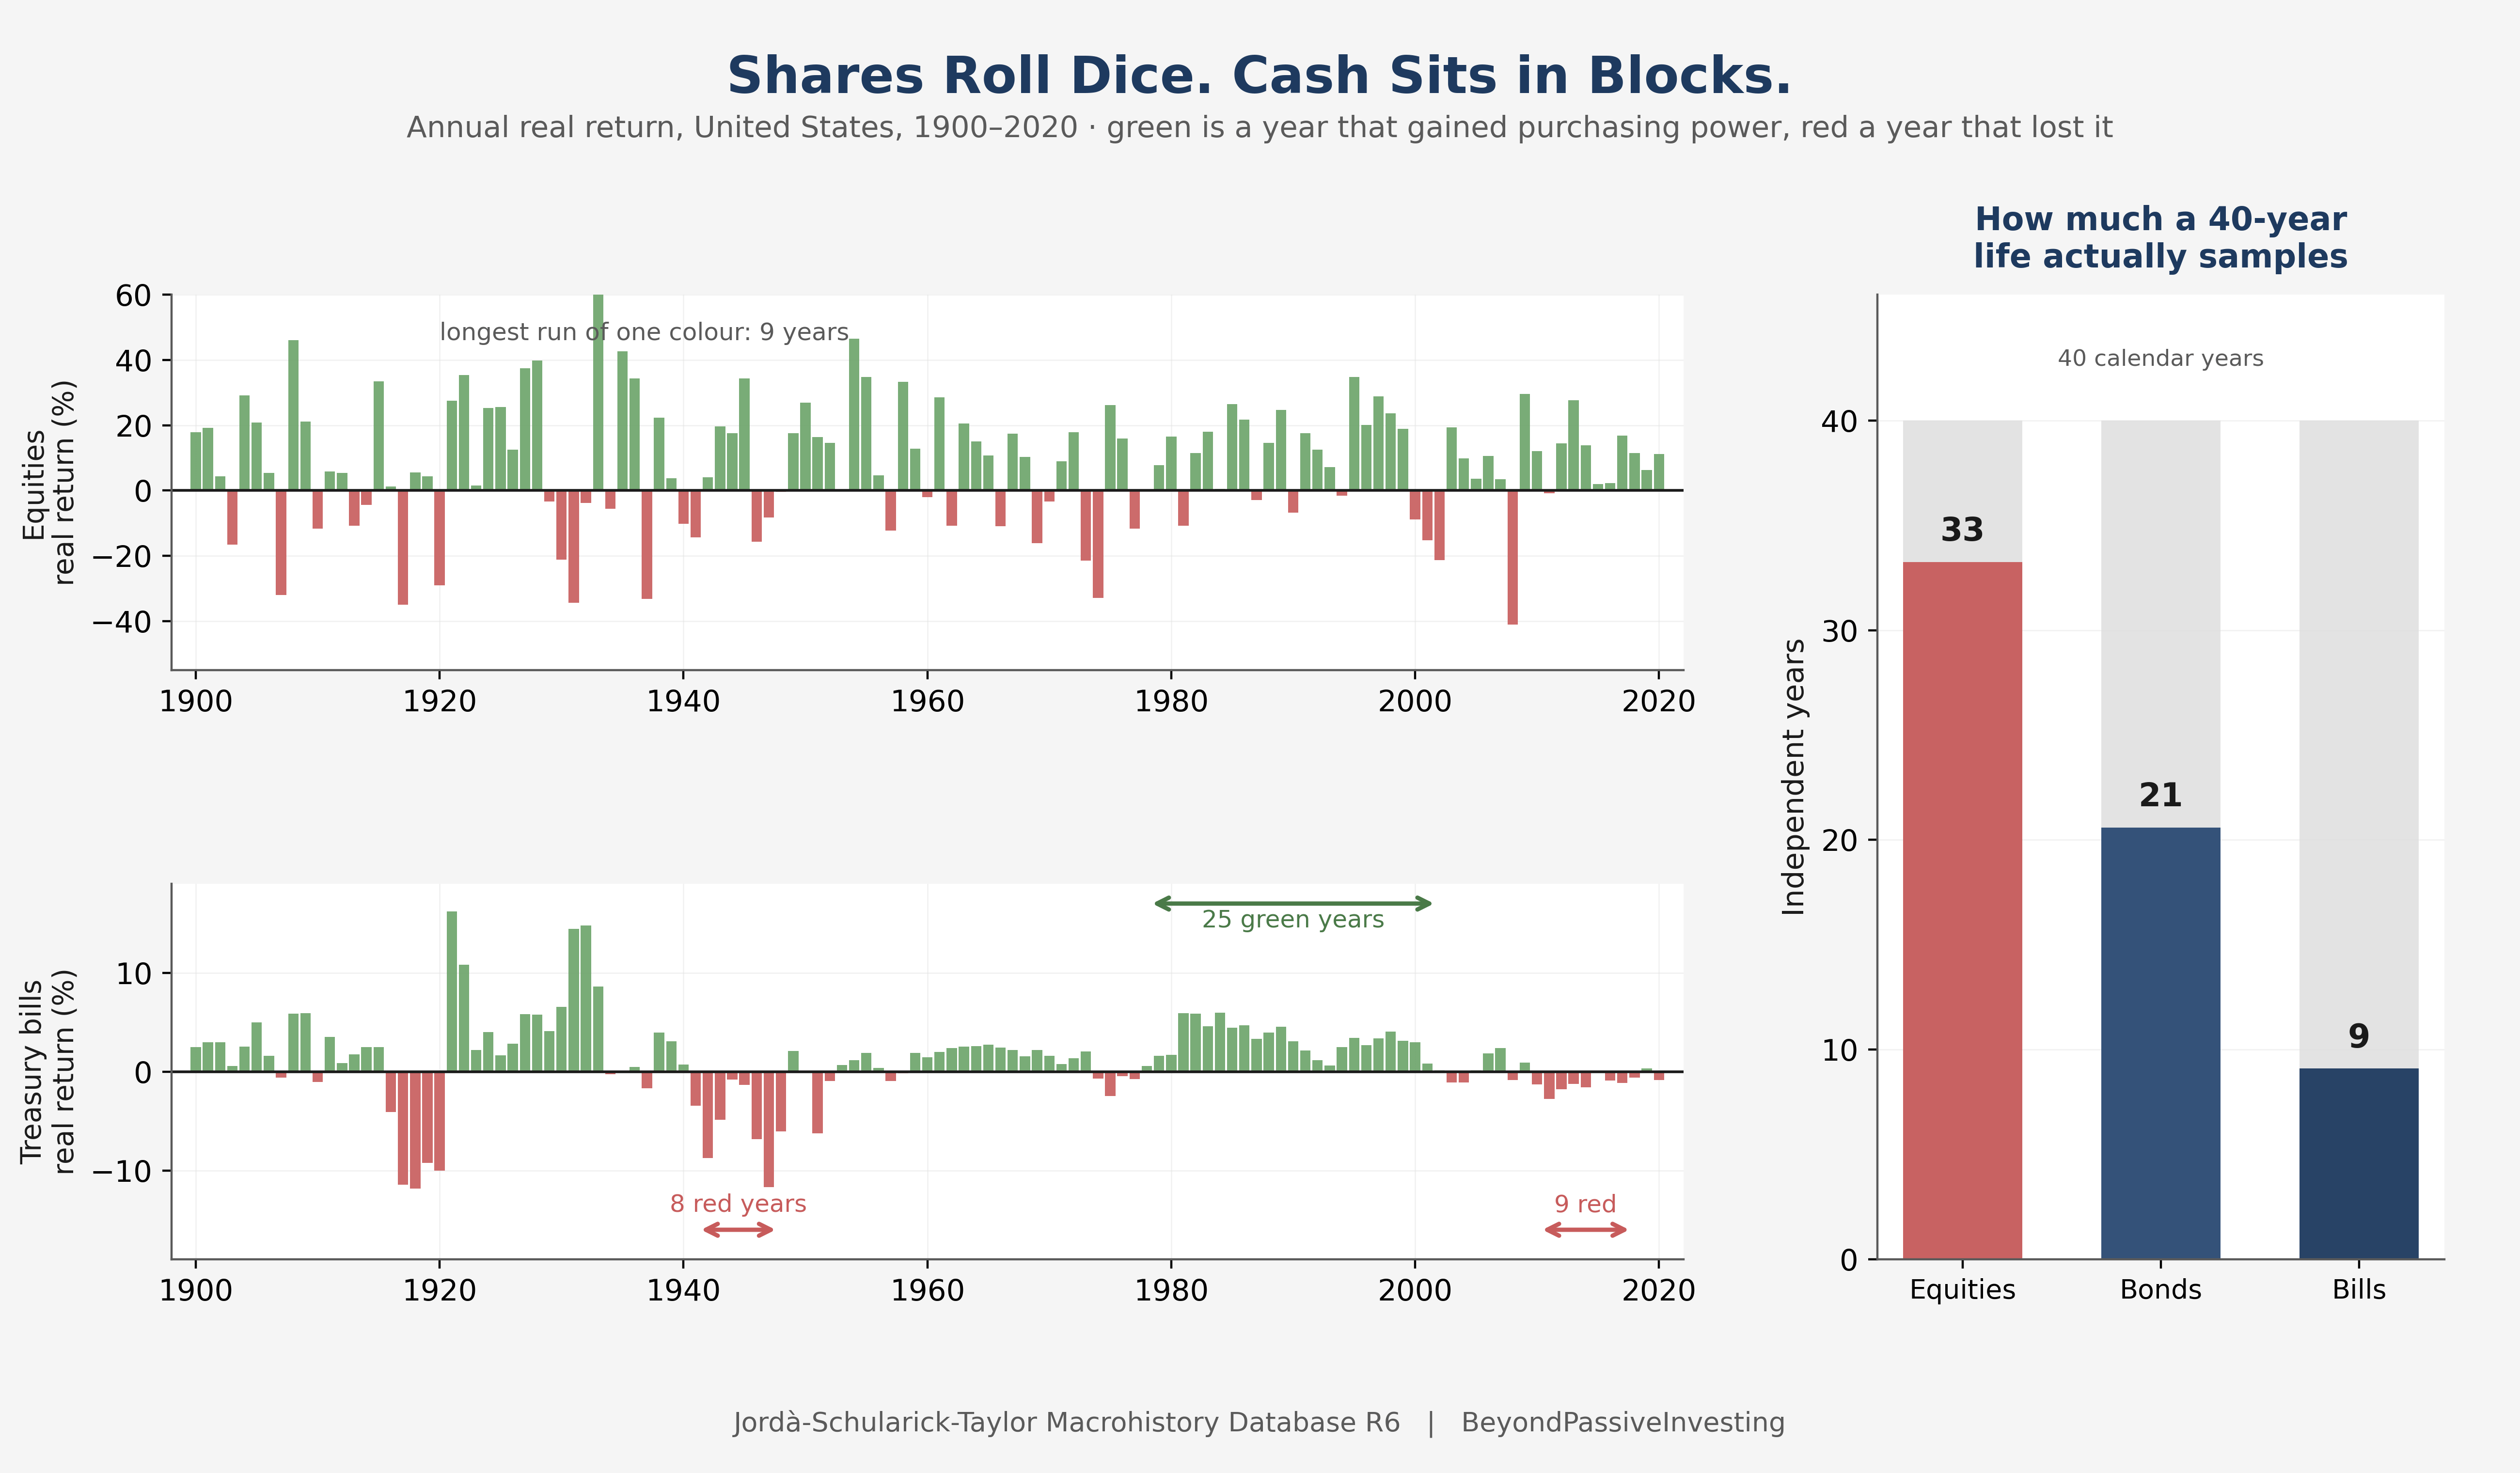
Look at the two rows of bars. The equity years are a coin toss. Good and bad alternate, the longest unbroken run of either colour in 120 years is nine, and a saver who holds for four decades genuinely collects a mixture.
Cash is not doing that. It comes in blocks. Eight consecutive losing years from 1941, fifteen winning years from 1959, twenty-five winning years from 1978, nine losing years from 2010. Cash pays the policy rate minus inflation, and neither of those things changes its mind from one year to the next. They drift for a decade at a time.
The consequence is on the right. Because equity years are near enough independent, forty calendar years give a saver about thirty-three independent observations, and the mixture really is a mixture. In cash the same forty years give about nine. The saver does not draw forty times from the distribution of possible outcomes. They land in one or two regimes and stay there.
Any experimentalist knows this distinction under another name. Averaging suppresses noise by the square root of the number of measurements, provided the measurements are independent. Against a systematic error it does nothing whatever, and you can measure for a century and be exactly as wrong on the last day as on the first. Equities carry the random error. Cash carries the systematic one, and the systematic one is monetary policy.
What this is not
This is not an argument that cash is bad, and it is certainly not an argument for holding something else instead. Cash did its job in both of the good regimes and it is the only asset here with no mark-to-market risk at all, which matters enormously if the money is needed next month rather than next decade.
The argument is narrower. Zero volatility and positive real return are two different properties, and only the first one is promised. Cash delivers certainty about the number and no certainty at all about the value, and the failure mode does not announce itself, which is why it has a name in the literature and no name in ordinary conversation.
Which leaves the line that started this. Waiting in cash is not the absence of a decision. It is a position with a distribution attached, and that distribution has a forty-three-year left tail inside living memory. Whatever else one does with that, the first step is to stop calling it the risk-free asset and start calling it what it is, which is the asset whose risk does not show up on the statement.
Data
Bill rates, equity and bond returns and consumer prices are from the Jordà-Schularick-Taylor Macrohistory Database, Release 6, covering sixteen advanced economies from 1870 to 2020 [1]. Cash is modelled as short government bills rolled continuously, with no credit risk and no transaction costs, which flatters it slightly relative to a real deposit account.
References
Jordà, Ò., Schularick, M. and Taylor, A. M. “Macrofinancial History and the New Business Cycle Facts.” NBER Macroeconomics Annual 31, 2017. Macrohistory Database, Release 6.
Fisher, I. The Money Illusion. Adelphi, New York, 1928.
Reinhart, C. M. and Sbrancia, M. B. “The Liquidation of Government Debt.” Economic Policy 30(82), 2015, pp. 291–333.
Siegel, J. J. Stocks for the Long Run. McGraw-Hill, 5th edition, 2014, on the long-run real return of bills.
hell of an article!
The bank-statement example really stayed with me. A visible loss invites us to reconsider; a steadily rising balance can make reconsideration feel unnecessary. That makes the risk you describe especially difficult to respond to: the saver keeps receiving what looks like reassurance. I also appreciate that you preserve cash’s purpose for near-term needs. “Safe for what, and for how long?” seems a much more useful question than simply asking whether an asset is safe. Your discussion of persistent regimes adds another layer: a person has one saving lifetime, and it may look very different from the long-run average. A thoughtful piece about a risk that is easy to overlook precisely because it feels so uneventful.